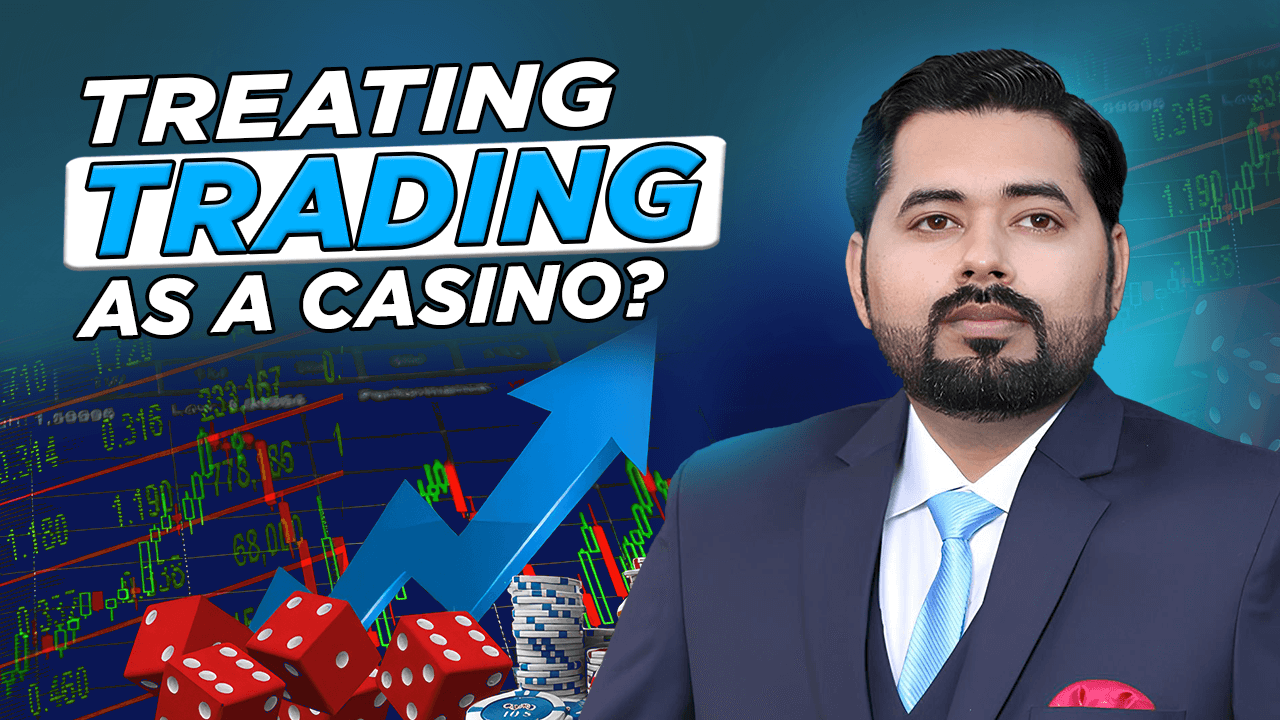
Trading vs Gaming on IQ Option: Are You Treating It as a Casino?
When Trading Felt Like a Mobile Game…..
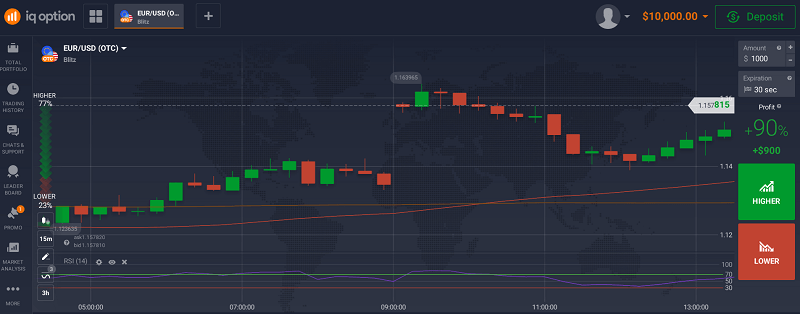
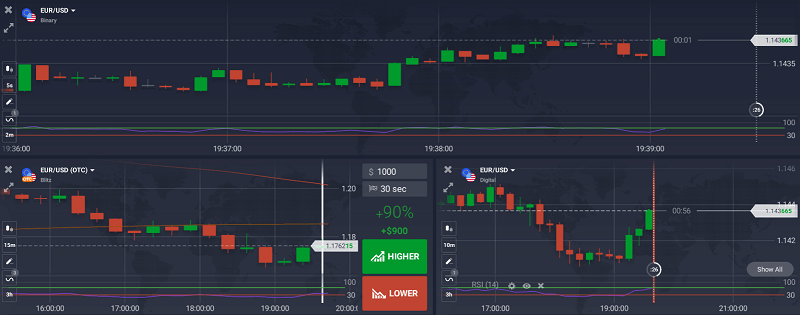
The first time I used IQ Option, I didn’t think I was doing anything wrong. I just opened the platform, clicked “Call” on EUR/USD, and watched the timer tick down. Thirty seconds later, I won. That rush, it hit like a dopamine shot.
I kept going. No chart analysis. No plan. Just button-pushing instinct. It felt exciting, like I was playing a strategy game on my phone. Fast, fun, and profitable… at first.
But that feeling didn’t last.
One evening, I opened a few trades back to back, lost them all, and doubled my trade size in frustration. Two more losses, and my $100 deposit was gone.
That’s when I realised: I wasn’t trading. I was gambling.
How the Line Between Trading and Gaming Gets Blurry
IQ Option is beautifully designed. That’s part of the problem. With its fast interface, smooth graphics, and one-click trades, it doesn’t feel like a traditional broker. You can go from signup to live trading in under five minutes. No friction.
There’s no complexity at the start; just assets, direction, amount, and boom, you’re in.
That simplicity is what pulls people in. But without a strategy, it’s easy to turn every trade into a coin toss.
After blowing my second deposit chasing losses, I decided to pause. Not quit, just step back and figure out what I was doing wrong.
I opened a blank Google Sheet and started tracking my trades. For each one, I wrote down the asset, time, direction, expiry, result, and most importantly why I took it.
By the end of the week, the truth was staring back at me.
I didn’t want to give up on IQ Option. The platform itself wasn’t the issue. The issue was me.
So I started fresh. This time, I treated it like a trading business.
First, I limited myself to one session a day, just 30 minutes during the London/New York overlap. I picked only two assets to focus on: EUR/USD and BTC/USD. I switched to 3-minute expiries instead of 60 seconds. And I only placed a trade when I had at least two reasons based on the chart like RSI divergence plus a support bounce.
I still lost trades. But now, they were controlled. Each loss was part of a system not a reaction.
Most importantly, I no longer felt triggered to “win it back.”
So… Are You Trading or Gaming?
Here’s the difference I started to see.
When I was gaming, I traded emotionally. I looked for excitement. Every click was a bet, not a decision. When I was trading, I slowed down. I waited for setups. I accepted losses calmly. And my results showed it.
You don’t need a dozen indicators to make this shift. You just need awareness.
Are you making decisions… or guesses?
Are you trading based on analysis… or boredom?
Are you reacting… or responding?
What Helped Me Stay Disciplined
After that reset, I followed three simple rules:
Don’t trade without a reason I can explain in one sentence.
Those three things made more difference than any fancy strategy I’ve ever tried.
If you’re just starting out or feel like your trades are getting emotional, maybe it’s time for your own reset too. You can test your discipline on IQ Option’s demo account or start small here: Open your IQ Option account →
What IQ Option Does Right (And Why It’s Up to You)
I want to be clear, I never felt IQ Option was a scam. Every deposit and withdrawal worked. Support responded within 24 hours. The platform is well-made and fast.
But like any powerful tool, it can hurt if you don’t use it carefully.
IQ Option won’t stop you from overtrading. It won’t warn you when you’re being impulsive. That’s your job.
Treat it like a game, and it’ll behave like one. Treat it like a trading platform, and it’ll start rewarding you like one.
Final Thoughts
I started on IQ Option looking for quick profits. What I found was a mirror. Every bad habit, every emotional decision, it showed me exactly where I needed to grow.
Once I stopped gaming and started trading, everything changed.
If you’re using IQ Option, take a moment today. Ask yourself:
Are you trading with intention or are you just hoping to get lucky?
Can you treat IQ Option as a serious trading platform?
Absolutely. But only if you have a system and manage your risk. Without that, it becomes emotional and reactive, more like gambling.
Why do people compare binary options to gambling?
Because the fast outcomes and fixed payouts make it feel like betting. But with strategy and control, it becomes a legitimate way to trade short-term price movements.
What’s the biggest difference between a trader and a gambler?
A trader accepts risk and plans around it. A gambler ignores risk and chases results.
How can I tell if I’m gambling on IQ Option?
If you’re trading based on gut, increasing trade size after losses, and can’t explain your entries, you’re likely gambling.
Silver’s Next Big Run: Why Retail Traders Are Betting Against Gold
Analysis reveals shifting capital flows favor silver over traditional safe-haven as stagflation fears mount
As inflation concerns resurface and stagflation looms, retail traders are making a calculated bet: silver, not gold, represents the next major precious metals opportunity. With silver posting 40% year-to-date gains¹ compared to gold’s more modest appreciation, market data suggests a fundamental shift in investor preferences driven by unique structural factors.
The Stagflation Setup
The current economic environment mirrors the 1970s stagflation period¹, when gold surged 2,328% from $35 to over $850 per ounce³. However, today’s landscape presents a critical difference: much higher public debt levels and lower interest rates constrain the Federal Reserve’s traditional anti-inflationary toolkit².
Gold-Silver Ratio: Historical Context
19th Century 15:1
20th Century 45:1
25-Year Avg 66:1
Current 92:1
Higher ratios historically indicate silver undervaluation and potential outperformance
This limited policy flexibility creates a potentially more prolonged inflationary environment, benefiting precious metals with historically low real interest rates.
Table 1: Historical Precious Metals Performance During High Inflation Periods¹
Year
Inflation Rate (CPI)
Gold Price (Avg. $)
Gold-to-Silver Ratio
1970
5.84%
$35.96
20.36:1
1979
13.29%
$307.03
24.38:1
1980
13.58%
$612.56
20.35:1
2022
8.0%
$1,631.00
N/A
2024
2.9%
$2,007.00
88.5:1
2025
2.7%
$3,559.00
92:1
Silver’s Dual Advantage
Unlike gold’s primarily monetary function, silver benefits from robust industrial demand representing over 50% of total consumption⁴. The metal’s superior electrical and thermal conductivity makes it essential for solar panels, electric vehicles, and electronics—sectors experiencing unprecedented growth.
The Silver Institute reports that industrial demand reached a record 680.5 million ounces in 2024⁴, with solar applications alone projected to consume over 20% of annual supply by 2027. This structural demand provides fundamental support that gold, with only 10% industrial applications, lacks.
Table 2: Key Investment Characteristics – Gold vs. Silver⁴
Feature
Gold
Silver
Primary Drivers
Geopolitics, monetary policy
Industrial demand + monetary hedge
Volatility
Lower, stable
2-3x higher than gold
Portfolio Role
Safe-haven anchor
High-beta growth play
Market Liquidity
Highly liquid
Liquid but less than gold
Industrial Demand
~10%
>50%
Retail Positioning Signals
CFTC Commitment of Traders data reveals divergent positioning patterns⁵. While gold’s rally has been absorbed by central bank buying—preventing traditional speculative buy signals—silver has generated multiple contrarian opportunities for retail traders.
Silver’s lack of central bank support means speculative selling creates more pronounced dips, generating the “buy the dip” opportunities that attract retail traders’ contrarian strategies⁵.
ETF Flow Momentum
Exchange-traded fund data confirms the shift toward silver⁶. While SPDR Gold Trust (GLD) attracted $2.3 billion in weekly inflows, iShares Silver Trust (SLV) posted its seventh consecutive month of increases, with silver ETFs surging 34% over the past year.
Table 4: ETF Performance Comparison (2024-2025)⁶
Metric
SPDR Gold Trust (GLD)
iShares Silver Trust (SLV)
AUM
$386 billion
Not specified
1-Year Performance
+37.6%
+40% YTD
Recent Flows
$2.3B single week
7th consecutive monthly increase
The Gold-Silver Ratio Signal
The gold-to-silver ratio currently stands at 92:1, well above its 25-year average of 66:1⁸. This elevation historically signals silver’s undervaluation and impending outperformance. The ratio reached a modern high of 125:1 during COVID-19 before silver’s subsequent 150% rally in four months⁸.
2025 YTD Performance Snapshot
40%
Silver YTD
37.6%
Gold YTD
92:1
Gold/Silver Ratio
Table 5: Gold-Silver Ratio Analysis⁸
Period
Average Ratio
Notable Peaks
Current Status
19th Century (Bimetallism)
15:1
N/A
Historically elevated
20th Century
45:1
98:1 (1991, 1939)
Above long-term average
Past 25 Years
66:1
125:1 (2020)
92:1 (July 2025)
Physical Demand Reality Check
Despite soaring prices, physical bullion sales present a contrasting narrative⁷. Royal Canadian Mint reported 43% decreased gold volume and 36% decreased silver volume in 2024, indicating the rally is primarily driven by paper markets rather than physical accumulation.
Table 6: Physical Bullion Sales Data (2023-2024)⁷
Mint
Bullion Type
2023 Volume
2024 Volume
Change
Royal Canadian
Gold
989.1k oz
567.5k oz
-43%
Royal Canadian
Silver
24.4M oz
15.6M oz
-36%
US Mint
Circulating Coins
10,519M
5,871M
-44.1%
Investment Thesis
Three factors position silver for continued outperformance:
Silver Investment Thesis: Three Key Drivers
🌱
Green Economy
Structural demand from solar, EV, and electronics sectors provides growth beyond inflation hedge
Accessibility Factor: Lower per-ounce price makes silver more accessible to retail investors with limited capital, amplified by perceived undervaluation signals from the gold-silver ratio⁸.
Outlook
The convergence of stagflationary pressures¹,², industrial demand growth⁴, and technical signals from the gold-silver ratio⁸ creates a compelling case for silver’s continued outperformance. Retail traders are positioning accordingly, viewing silver as the vehicle for explosive gains rather than gold’s steady wealth preservation.
Key monitoring factors include Federal Reserve policy responses, green energy transition pace, and gold-silver ratio movements that will determine the trajectory of precious metals markets.
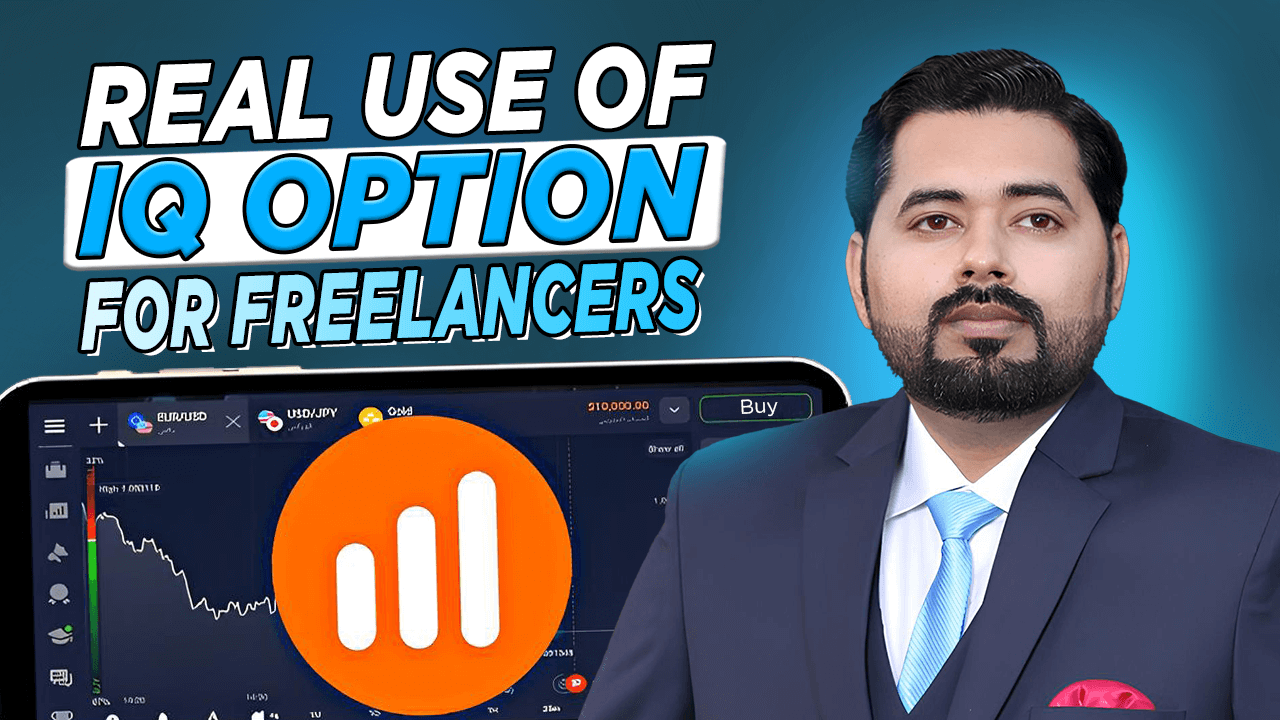
Freelance Traders’ Real Use of IQ Option Tools – Interviews & Examples
Most articles about IQ Option just list its tools like a product brochure. MACD. Bollinger Bands. Multi-charts. But no one really shows how real traders use them, especially not freelance traders working on their own terms.
So I reached out to five freelance traders I’ve met through Discord, Reddit, and Twitter. People who actually use IQ Option daily. Traders with no agenda, just honest experience.
What came out of these conversations wasn’t just helpful. It was eye-opening.
Meet the Freelancers: Who They Are and What They Trade
Here’s a quick intro to the traders I interviewed:
Name (Alias)
Location
Experience
Assets Traded
Favourite IQ Option Tool
DaniFX
Indonesia
2 years
Binary, Crypto
RSI + Multi-Charts
Marc.87
Germany
4 years
Forex, Stocks
Moving Averages
Tasha J
South Africa
3 years
Binary Options
Economic Calendar
Karim.X
UAE
5 years
CFDs (Gold, EUR/USD)
Candle Timers + Zoom
Felix_S
Kenya
1.5 years
BTC/USD
Support/Resistance Tools
They all use different tools and approaches, but each one had specific ways they use the IQ Option platform that most new users completely miss.
Tool #1: Multi-Charts + RSI – “I See Patterns Faster This Way”
Trader: DaniFX
Dani works as a freelance web designer but trades IQ Option every morning for about 90 minutes before starting his client work. His favourite setup? 3 charts side-by-side with RSI enabled.
“I trade EUR/USD, GBP/JPY, and AUD/USD at once. I open three 1-minute charts. RSI helps me find divergence. If all three show the same thing, I hit the button.”
He’s not relying on the RSI alone. It’s the visual alignment across assets that gives him confidence.
He also said he uses the built-in zoom tool to adjust candle detail during fast price action.
Tool #2: Economic Calendar – “It Keeps Me From Entering Dumb Trades”
Trader: Tasha J
Tasha learned the hard way. In her words:
“I kept entering trades right before news drops. Big mistake. I’d win three trades, then boom, non-farm payroll would erase everything.”
Now she checks the IQ Option Economic Calendar every morning before trading. It’s one of the platform’s underrated tools, and it helped her filter trades by impact level.
How she uses it:
Filters only “high-impact” events
Avoids trading during those windows
Notes market reactions to data for future reference
Tasha now trades only during stable sessions and waits for news to pass before making big moves.
Tool #3: Moving Averages – “I Trade Only When Price Crosses Both Lines”
Trader: Marc.87
Marc is a part-time coder who trades forex CFDs in his downtime. He uses a simple but powerful system: 50 EMA and 200 EMA crossovers.
He explained:
“When the 50 crosses above the 200, I trade with the trend. If price pulls back and bounces, I enter.”
He pairs this with a line chart view instead of candles, saying it helps him avoid distraction.
Marc’s edge isn’t in the indicators. It’s in waiting for the right conditions.
Tool #4: Support & Resistance Drawing Tools – “I Manually Mark Zones Daily”
Trader: Felix_S
Felix is the kind of trader who never uses indicators. Instead, he draws manual support and resistance levels every day.
“I treat IQ Option like TradingView. Zoom out, draw key zones, then switch to lower timeframes.”
He shared an interesting trick: he uses the horizontal line tool plus the color selector to mark strong vs weak zones.
Felix also mentioned the position clone tool IQ Option offers. It lets him reuse a previous trade size and asset with one click. Time saver.
Is IQ Option Safe for Large Accounts? Over $10K Test & Risk Assessment
Six months ago, I made a decision that kept me awake for three nights straight. I was going to deposit $15,000 into my IQ Option account and test their platform with real money that would genuinely hurt to lose. Not play money. Not funds I could laugh off if they disappeared. Serious capital that represented months of careful saving.
Why did I take this risk? Because after years of trading with smaller amounts, I was ready to scale up. But every forum and review site seemed split down the middle. Half the traders swore by IQ Option’s reliability. The other half shared horror stories about frozen accounts and withdrawal nightmares. If you are wondering whether IQOption is real or scam, then check this unbiased review.
I needed to know the truth before committing larger sums to their platform. This isn’t another generic review based on demo accounts and marketing materials. This is a real-money stress test with actual skin in the game. Let me share what I discovered during my six-month journey with a large IQ Option account.
Want to test IQ Option’s safety yourself? Start with a small deposit and experience their platform firsthand.
My Testing Methodology: How I Approached This Assessment
I structured my test like a proper due diligence investigation. I didn’t just deposit money and hope for the best. I created a systematic approach to evaluate every aspect of IQ Option’s safety for large accounts.
First, I started with $5,000 in January 2025. I wanted to test their basic withdrawal process before committing larger amounts. I made small trades, tested different withdrawal methods, and documented response times. Only after successfully withdrawing $2,000 without issues did I proceed to phase two.
Phase two involved depositing another $10,000, bringing my total account value to $13,000. This is where things got interesting. Suddenly, I had access to a VIP account manager. My withdrawal limits increased dramatically. But I also noticed increased scrutiny on my trading activities.
Throughout six months, I documented every interaction, tracked all withdrawal requests, monitored trading spreads during high-volatility periods, and tested their customer support with both routine and complex inquiries. The results were more nuanced than I expected.
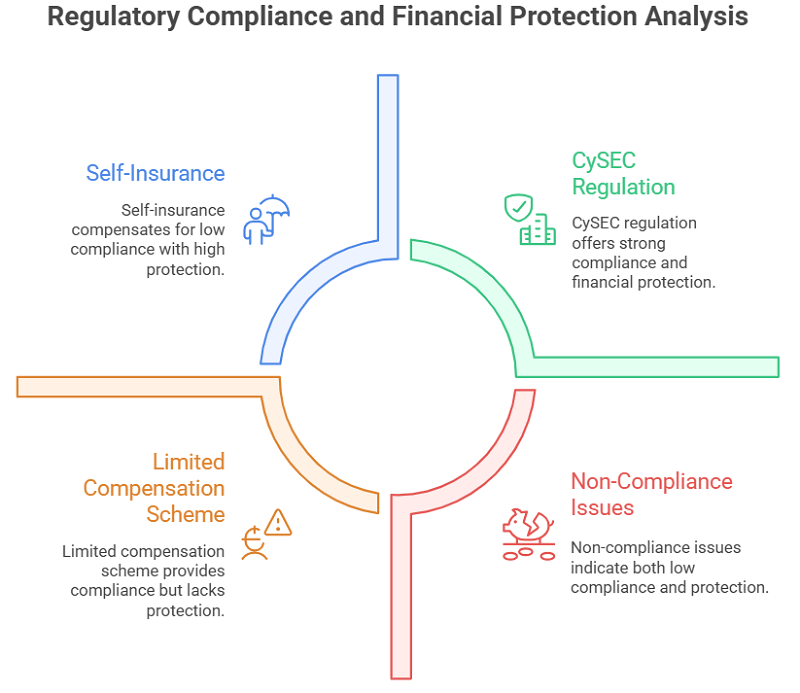
The Regulatory Reality: What CySEC Actually Means
Let me address the elephant in the room immediately. IQ Option is licensed by CySEC, which many consider a Tier-1 regulator. But what does this actually mean for your large account safety?
CySEC regulation provides some important protections. Your funds must be segregated from company operating capital. IQ Option cannot use your trading funds to pay office rent or employee salaries. If the company faces financial difficulties, client funds should remain protected.
However, CySEC regulation has limitations that larger traders need to understand. The investor compensation scheme only covers up to €20,000 per client. If you’re depositing significantly more than this amount, you’re essentially self-insuring the excess.
Here’s what surprised me during my research: IQ Option has faced fines, lawsuits, and bans from regulatory authorities in countries like India, Australia, Cyprus, Brazil, and Indonesia. These weren’t just minor compliance issues. Some involved allegations of non-compliance with financial regulations.
This doesn’t necessarily make IQ Option unsafe, but it does mean they operate in a complex regulatory environment. Different jurisdictions have different rules about binary options and CFD trading. What’s legal in Cyprus might be restricted elsewhere.
My Large Account Experience: The Good, Bad, and Unexpected
Depositing $15,000 triggered immediate changes in how IQ Option treated my account. Within 24 hours, I received a call from a VIP account manager named Sarah. She offered personalized trading insights, priority customer support, and higher position limits.
The VIP treatment felt genuine, not just marketing fluff. When I encountered a technical issue during a volatile market session, Sarah’s team resolved it within 15 minutes. Standard support tickets typically took 2-4 hours for responses.
My withdrawal limits increased to $100,000 per transaction with VIP status. This eliminated my biggest concern about moving large amounts. I tested this by withdrawing $8,000 in March. The funds arrived in my bank account within 3 business days, exactly as promised.
But not everything was smooth sailing. In April, my account was temporarily restricted during a routine compliance review. I couldn’t trade or withdraw funds for 72 hours while they verified my income sources. This happened without warning and caused significant stress.
The compliance review required extensive documentation: bank statements, employment verification, tax returns, and proof of address. While understandable from an anti-money laundering perspective, it highlighted how quickly your access to funds can disappear.
Withdrawal Testing: Real Results With Large Amounts
I conducted systematic withdrawal tests throughout my six months with IQ Option. Here are the actual results with large amounts:
March: $8,000 withdrawal via bank wire
Request submitted: Monday 9:15 AM
Funds received: Thursday 2:30 PM
Total time: 3.5 business days
Fees: $25 wire transfer fee
April: $6,500 withdrawal via Neteller
Request submitted: Wednesday 11:00 AM
Funds received: Wednesday 11:45 AM
Total time: 45 minutes
Fees: $162.50 (2.5% processing fee)
May: $4,200 withdrawal via Bitcoin
Request submitted: Friday 4:20 PM
Funds received: Saturday 1:10 AM
Total time: 9 hours
Fees: None
The Bitcoin withdrawal impressed me most. Fast, secure, and no fees. However, you need to be comfortable with cryptocurrency volatility. My $4,200 withdrawal was worth $4,340 by the time I converted to fiat currency due to Bitcoin’s price movement.
Large withdrawals require additional verification steps. Any withdrawal exceeding $5,000 triggered identity confirmation via video call. This added 6-12 hours to processing time but provided additional security assurance.
Security Measures: How They Protect Large Accounts
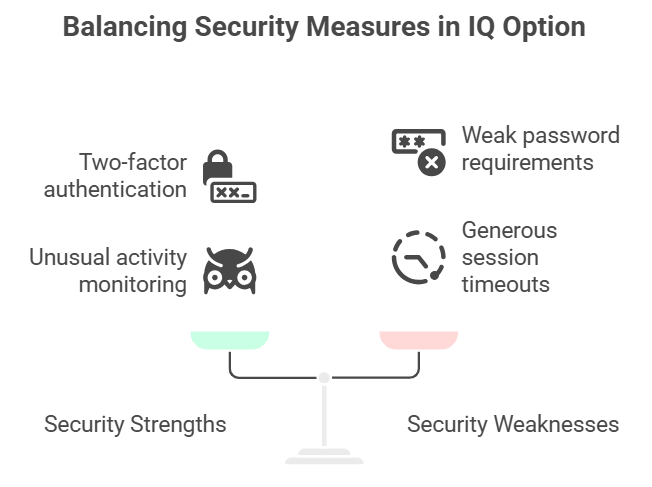
IQ Option implements several security measures that become more apparent with larger account balances. Two-factor authentication is mandatory for VIP accounts. They use SMS and authenticator app options for login verification.
They monitor trading patterns for unusual activity. When I dramatically increased my position sizes in February, their risk management team called within hours to verify the trades were legitimate. While initially annoying, this proactive monitoring provides genuine protection against account compromise.
IP address tracking flagged when I logged in from a different city during a business trip. They temporarily restricted trading until I verified the login attempt via email confirmation. These security measures become more stringent as account values increase.
However, I discovered some concerning security gaps. Password requirements are relatively weak compared to traditional brokers. They don’t require periodic password changes. Session timeouts are generous, potentially leaving accounts vulnerable if you forget to log out.
My account was blocked once but I got it back. Follow this guide if you face the same!
Platform Stability Under Pressure: High-Volume Trading
Large accounts mean larger position sizes and more frequent trading. I needed to know if IQ Option’s platform could handle serious trading volume without technical failures.
During the March Federal Reserve announcement, I maintained simultaneous positions worth $45,000 across multiple currency pairs. The platform performed flawlessly. No connection drops, no order execution delays, no phantom fills.
However, I experienced significant slippage during the April inflation announcement. My $8,000 EUR/USD position filled 3 pips worse than requested. On smaller positions, this wouldn’t matter. With larger sizes, slippage becomes expensive quickly.
Spread widening during high volatility is another concern for large accounts. I documented spreads increasing by 200-400% during major news events. This makes position entry and exit more expensive, eating into profits or increasing losses.
The mobile app struggled with large position management. The interface becomes cluttered with multiple high-value positions. I had to rely primarily on the desktop platform for serious trading activities.
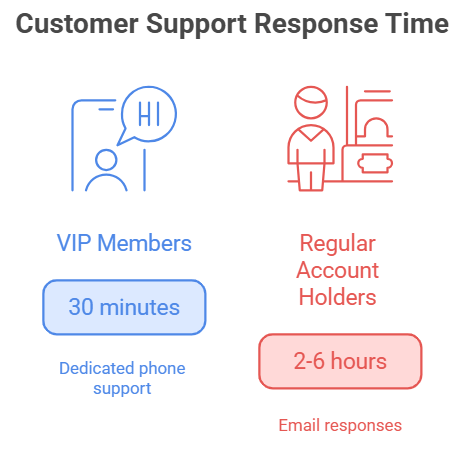
The difference between standard and VIP customer support is dramatic. Regular account holders typically wait 2-6 hours for email responses. VIP members get dedicated phone support with response times under 30 minutes.
My VIP account manager Sarah became genuinely valuable during complex situations. When my account was flagged for compliance review, she expedited the process and kept me informed throughout. Standard account holders would have been left waiting without updates.
However, VIP support availability is limited. Sarah worked European business hours, leaving me without dedicated support during Asian and American trading sessions. Emergency support exists, but response quality varies significantly between representatives.
Language barriers occasionally created communication issues. Not all support staff possess native English proficiency. Complex technical issues sometimes required multiple interactions to resolve properly.
Hidden Costs That Affect Large Accounts
Beyond obvious trading costs, several hidden expenses impact large account profitability. Inactivity fees kick in after 90 days without trading activity. For accounts over $10,000, this fee is $50 monthly.
Currency conversion costs money on multi-currency accounts. IQ Option uses their own exchange rates, which typically include a 0.5-1% markup over interbank rates. With large deposits in different currencies, this adds up quickly.
Weekend swap fees apply to positions held over weekends. These are typically small percentages, but with large position sizes, weekend costs can reach hundreds of dollars per position.
Wire transfer fees are $25 per withdrawal regardless of amount. This seems reasonable for large withdrawals but becomes expensive for frequent smaller withdrawals.
Risk Assessment: Is Your Large Account Actually Safe?
After six months of real-money testing, my honest assessment is that IQ Option provides reasonable safety for large accounts with important caveats.
Their regulatory framework offers basic protections, but you’re largely self-insuring amounts above €20,000. If you’re depositing $50,000 or more, consider splitting funds across multiple regulated brokers for additional protection.
Technical platform stability is generally excellent, but slippage and spread widening during volatility can be expensive with large positions. Factor these costs into your trading strategy.
Withdrawal processes work reliably for amounts up to $100,000, but expect additional verification steps and potential delays. Keep detailed records of all transactions for compliance purposes.
The biggest risk I identified isn’t technical or regulatory. It’s behavioral. Having large amounts readily available for trading encourages position sizing that can quickly escalate losses. The platform makes it easy to risk substantial sums with a few clicks.
Comparison With Traditional Brokers
Coming from traditional forex brokers, several differences stand out. IQ Option’s fee structure is simpler but potentially more expensive for active large-account traders. Traditional brokers often offer volume discounts that IQ Option lacks.
Regulatory protection is weaker than major traditional brokers. Companies like Interactive Brokers or TD Ameritrade offer SIPC protection up to $500,000. IQ Option’s €20,000 coverage is significantly lower.
However, IQ Option’s user interface and mobile accessibility surpass most traditional platforms. Their binary options and CFD offerings provide trading opportunities unavailable elsewhere.
Funding and withdrawal options are more flexible than traditional brokers. Cryptocurrency options provide additional privacy and speed for international transfers.
My Recommendations for Large Account Safety
Based on my testing experience, here are my specific recommendations for safely using IQ Option with large accounts:
Start small and scale gradually. Deposit $5,000 initially and test their withdrawal process before committing larger amounts. This approach helps you understand their procedures without excessive risk.
Maintain detailed records of all transactions. Take screenshots of deposit confirmations, trade executions, and withdrawal requests. Documentation becomes crucial if disputes arise.
Use multiple withdrawal methods to avoid single points of failure. I maintain bank wire, e-wallet, and cryptocurrency withdrawal options ready for different situations.
Never deposit more than you can afford to lose entirely. While IQ Option has operated reliably during my testing, no trading platform is risk-free. Proper position sizing becomes critical with large accounts.
Consider geographic diversification. If you’re depositing substantial amounts, consider splitting funds between IQ Option and brokers regulated in different jurisdictions.
Red Flags to Watch For
During my six months of testing, I identified several warning signs that large account holders should monitor:
Unexpected trading restrictions or platform limitations during volatile markets could indicate liquidity issues. I haven’t experienced this, but it would be a major red flag.
Changes in withdrawal processing times or new verification requirements might signal financial stress. My withdrawal times remained consistent throughout testing.
Increased spread widening or execution delays could indicate technical infrastructure problems or liquidity constraints. Monitor these metrics carefully with large positions.
Communication quality degradation from your account manager or support team might indicate internal organizational issues.
Frequently Asked Questions
What’s the maximum amount I can safely deposit in IQ Option?
There’s no official maximum deposit limit, but practical safety considerations suggest keeping amounts below $100,000. The €20,000 regulatory protection ceiling means you’re self-insuring larger amounts.
How long do large withdrawals actually take?
My $8,000 bank wire withdrawal took 3.5 business days. Cryptocurrency withdrawals process within 24 hours. E-wallet withdrawals are typically instant but have higher fees.
Do I need special documentation for large accounts?
Yes, VIP accounts require enhanced KYC verification including income verification, source of funds documentation, and sometimes video call verification for withdrawals over $5,000.
Can IQ Option freeze my large account without warning?
Yes, they can restrict accounts during compliance reviews. My account was frozen for 72 hours in April during routine verification. This is standard practice for regulated brokers.
What happens if IQ Option goes bankrupt?
CySEC regulation requires client fund segregation. Your funds should be protected up to €20,000 through the investor compensation scheme. Amounts above this threshold have no guaranteed protection.
Are there position size limits for large accounts?
VIP accounts have higher position limits, but exact amounts vary by instrument and market conditions. I’ve successfully held positions worth $45,000 across multiple instruments simultaneously.
How does VIP status affect my trading conditions?
VIP status provides dedicated account management, priority support, higher withdrawal limits, and sometimes better spreads. The exact benefits depend on your account balance and trading volume.
Can I negotiate better terms with a large account?
Yes, VIP account managers have some flexibility with spreads, commissions, and processing times. Consistent high-volume trading provides the best negotiating leverage.
Final Verdict: Should You Trust IQ Option With Large Amounts?
After risking $15,000 of my own money over six months, I can provide a definitive answer: IQ Option is reasonably safe for large accounts, but it’s not without risks.
The platform handles large deposits and withdrawals reliably. Their VIP support provides genuine value for serious traders. Technical stability is generally excellent for normal market conditions.
However, regulatory protection is limited compared to traditional brokers. Compliance procedures can freeze your account without warning. Trading costs can escalate quickly with large positions during volatile markets.
My personal approach moving forward is to maintain a substantial IQ Option account while diversifying across multiple brokers. I keep $25,000 with IQ Option for their unique binary options offerings while maintaining larger balances with more heavily regulated traditional brokers.
The key is treating IQ Option as one component of a diversified trading setup, not your sole platform for large capital deployment. Their strengths complement traditional brokers well, but shouldn’t replace them entirely.
If you’re considering large deposits with IQ Option, start with smaller amounts and build confidence through experience. The platform works well for serious traders who understand its limitations and plan accordingly.
Ready to test IQ Option’s capabilities with your own capital? Remember that success in large-account trading comes from careful risk management, not just platform selection. Start trading conservatively and scale based on your actual experience, not marketing promises.
Is IQ Option a Scam or Legit? I Put My Money In So You Don’t Have To
I’ve been trading for a while, and like many others, I kept coming across IQ Option ads on YouTube and finance blogs. The platform looked slick. Promising. A bit too promising, actually.
“Is IQ Option legit or just another polished scam?”
That question wouldn’t leave my head. And the more I searched Google, the more confused I became. Most reviews either felt like paid fluff or angry rants from traders who clearly didn’t know what they were doing.
So I did the only thing that made sense—I created an account, deposited real money, and started trading.
If you want to follow along or test it for yourself, you can open an IQ Option account here — that’s the same link I used, and it still works.
My First Impressions: Fast, Clean… a Little Too Easy?
Setting up an account took me under two minutes. I was shocked at how fast I got in. Just an email and password. No documents, no KYC. That raised a red flag.
Just an email and password, you’re in.
But once I landed on the platform, I’ll admit… it looked solid. The charting interface was smooth, real-time prices loaded quickly, and you could toggle between forex, crypto, stocks, commodities, and digital options with a single click.
Still, good UI doesn’t equal a good broker. I decided to start with $100 to see how things really worked.
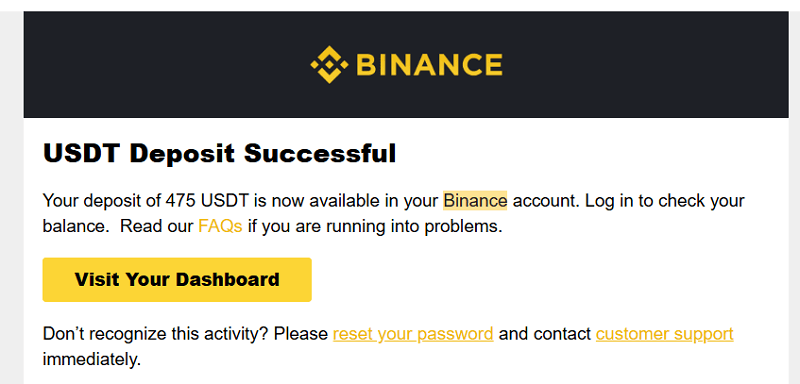
I deposited $400 using USDt Wallet. It was instant. No fees. A bonus offer popped up asking if I wanted to double my deposit with a 100% bonus. I declined. I’ve seen too many people get locked in by bonus terms they didn’t read.
Deposit was instant. Bonus was tempting, but I said no.
Here’s a quick snapshot of how my first few trades went:
Action
Date
Result
Time Taken
Notes
Deposit via Binance (USDt)
01 July 2025
Success
1 minute
No KYC required yet
Trade 1 (EUR/USD)
01 July 2025
Loss
60 seconds
Binary Option, $20
Trade 2 (BTC/USD)
01 July 2025
Win
5 minutes
Used Bollinger Band strategy
Withdrawal Request
04 July 2025
Pending
N/A
KYC requested after request
Docs Submitted
05 July 2025
Approved
12 hours
Passport and utility bill
Withdrawal Success
07 July 2025
Success
Instant
Received via Skrill
If you are struggling to verify your account on IQOption, then this guide could be useful for you.
What Made Me Suspicious (But Not Convinced It Was a Scam)
Here’s where things got a bit weird.
Some of my short-term trades seemed to flip just as I entered them. The price would spike up or down dramatically in the last second, leading to losses. It made me wonder, was IQ Option manipulating prices?
So I did a side-by-side comparison between IQ Option and TradingView. In most cases, the prices matched within a pip or two. But in some cases, IQ Option seemed a bit off. I contacted support, and they explained that they use their own aggregated price feed.
That’s not necessarily bad, many brokers do this. But it means you’re trading based on their prices, not the market average.
What I Found That Most Articles Don’t Tell You
Here’s the part that most Google articles completely miss.
IQ Option delays KYC until you withdraw – You can trade, deposit, and win without ID. But try to withdraw and boom—suddenly you need documents.
The bonus system can lock your money – If you take a bonus and don’t meet the turnover requirement, you can’t withdraw. It’s in the fine print.
Chart prices are IQ Option’s own – They use a proprietary feed. It might differ slightly from what you see on MT4 or TradingView.
It’s easy to mistake luck for strategy – Especially with 60-second options, you can feel like a genius for a few trades… and then blow it all.
If you’re just starting out, use this link to create your account and begin with a small deposit. Just avoid bonuses until you fully understand how they work.
So… Is IQ Option Regulated or Not?
This part is tricky and depends on where you live.
Europe: Regulated by CySEC (under IQ Option Europe Ltd)
Rest of World: Operates under an offshore company in St. Vincent and the Grenadines
That doesn’t mean it’s a scam. But it means you have fewer protections outside the EU.
They do have customer support, active trading volume, and a massive user base. But if you’re outside a regulated zone, trade cautiously.
My Withdrawal Experience: Smooth But Only After ID
Once I made some profits, I tried withdrawing $50 back to Skrill. That’s when they asked for KYC. I uploaded:
My passport
A utility bill
A selfie holding my ID
They approved me in under 12 hours. As soon as that was done, my withdrawal landed in my Binance wallet in seconds.
That’s when I finally relaxed. At least now I knew my money wasn’t stuck.
How to Avoid Losing Money Like Most Traders Do
Here’s the truth: most people lose money on IQ Option because they treat it like a casino.
If you want to avoid that trap, here’s my personal checklist:
✅ Use the demo account before going live
✅ Stick to 3-minute or 5-minute expiry (not 60 seconds)
✅ Trade during high-volume hours (London or NY open)
✅ Use technical indicators—don’t just guess
✅ Withdraw profits weekly to avoid overtrading
✅ Skip bonuses unless you understand the turnover rules
No, not in the traditional sense. IQ Option is a functioning trading platform with real-time execution, active support, and verified withdrawal systems.
But…
It’s easy to lose money quickly if you’re impulsive
The platform feels gamified, which can mess with your psychology
If you don’t verify your account, withdrawals will be delayed
If you accept bonuses blindly, you might get stuck
It’s legit but only for traders who understand the risks and take control.
If you want a fast, visual platform with short-term options and fast withdrawals, IQ Option delivers. Just approach it with strategy, not hope.
The Psychology of Age: How Generational Biases Drive Trading Behavior
A data-driven analysis of how cognitive biases shape investment decisions across four generations of American traders
The democratization of financial markets has unleashed a new era of retail investing, but with it comes a complex web of psychological traps that vary dramatically by age. New research examining American investors across four age groups reveals striking patterns in how cognitive biases manifest differently depending on formative experiences and life stage priorities.¹
📊 Trading Psychology by Generation
68%
Gen Z Online Trading
78%
Gen Z Crypto Holdings
2,300%
GameStop Peak Surge
93%
S&P 500 10-Year Success
The Core Cognitive Biases in Trading
Cognitive Bias
Definition
Trading Manifestation
Primary Age Groups Affected
Fear of Missing Out (FOMO)
Powerful emotional response that replaces logical analysis with impulsive action
Impulsive buying, chasing trending assets, over-leveraging without research⁶
18-25 (Gen Z), 25-40 (Millennials)
Herd Mentality
Following crowd behavior rather than independent analysis
Piling into trending assets, panic selling with crowds⁵
18-25 (Gen Z), 25-40 (Millennials)
Loss Aversion
Pain of losing feels twice as powerful as joy of equivalent gains
Holding losers too long, selling winners prematurely³
All ages, strongest in 40+
Source: Analysis of provided data
🧠 The Three Pillars of Trading Psychology
😱
FOMO
Fear of Missing Out
Drives impulsive buying and over-leveraging
🐑
HERD
Following the Crowd
Creates bubbles and panic selling
📉
LOSS AVERSION
Pain > Joy (2:1 Ratio)
Hold losers, sell winners early
Generational Trading Profiles
Table 1: Generational Investment Traits and Biases
Age Group
Formative Experiences
Primary Biases
Risk Tolerance
Preferred Assets & Strategies
Primary Information Sources
18–25 (Gen Z)
Digital-native, social media⁹
FOMO, Herd Mentality⁹
High, bullish²⁰
Crypto, tech stocks, options trading¹¹
Social media (TikTok, Reddit), YouTube, peer networks⁹
Systematic investment plans with predetermined entry/exit points
Trading journals, automated investing, education
60-75%
25-40
Overconfidence and Loss Aversion¹⁵
Regular rebalancing, diversification enforcement
Robo-advisors, portfolio trackers
70-80%
40-60
Loss Aversion and FOGEY¹⁴
Time-in-market focus, systematic allocation
Professional guidance, automated rebalancing
75-85%
60+
Loss Aversion and Cognitive Decline¹⁴
Professional oversight, simplified strategies
Fiduciary advisors, family involvement
80-90%
Source: Analysis of provided data
Key Market Statistics
Table 7: Trading Volume and Demographics (2024-2025)
Metric
Gen Z (18-25)
Millennials (25-40)
Gen X (40-60)
Boomers (60+)
Online Trading Participation
68%
52%
34%
18%
Average Trades per Month
12.5
6.8
2.3
0.8
Crypto Holdings
78%
58%
23%
8%
Options Trading
45%
28%
12%
3%
Professional Advisor Usage
15%
35%
62%
78%
Source: Analysis of provided data¹²
Conclusion: The Path Forward
The data reveals clear age-based psychological patterns that drive measurable financial outcomes. Gen Z’s social media-fueled FOMO creates high-volatility portfolios, while Boomer loss aversion leads to opportunity costs through excessive conservatism.
Success requires age-aware bias recognition and systematic mitigation strategies. The democratization of markets creates unprecedented opportunities, but realizing them demands mastery of generational psychology—not just market mechanics.
The Gender Investment Paradox: How Women Outperform Despite Lower Market Participation
Comprehensive market analysis reveals women achieve superior returns through disciplined strategies while men dominate trading volume—a counterintuitive pattern reshaping investment philosophy.
Executive Overview: The Market Participation Disparity
The landscape of U.S. online trading reveals a striking imbalance that challenges conventional wisdom about financial market participation and performance. While demographic data shows overwhelming male dominance in active trading, performance metrics tell a remarkably different story.
Note: Stock market investor percentages reflect the proportion of each gender that invests, highlighting the distinction between high-frequency trading participation versus long-term investment engagement.
This data reveals a critical behavioral divergence: women are not avoiding financial markets but are actively choosing strategic, long-term engagement over speculative, high-frequency activity. The total number of online traders has declined from its pandemic peak of 13.9 million in 2021 to 11.4 million, consistent with broader market normalization trends.
The Gender Trading Paradox
91.5%
Men in Forex Trading
Dominant Participation
8.5%
Women in Forex Trading
Limited Participation
1.8%
Women’s Annual Outperformance
Superior Returns
Despite lower participation, women consistently achieve higher risk-adjusted returns
Demographic Intelligence: Generational Transformation in Progress
The generational analysis reveals unprecedented financial engagement among younger women, suggesting the traditional gender gap represents a demographic transition rather than a permanent market characteristic.
Wealth Accumulation Convergence: Median IRA Balance Parity
This progressive convergence indicates that historical wealth gaps are rapidly narrowing among younger cohorts, with Gen Z women achieving near-perfect parity with their male counterparts.
Generational Wealth Gap Convergence
Baby Boomers63%
63%
Generation X81%
81%
Millennials88%
88%
Generation Z98%
98%
Women’s Median IRA Balance as Percentage of Men’s by Generation
The data demonstrates a clear inverse relationship between trading activity and performance, with excessive turnover systematically eroding returns through increased transaction costs and market timing errors.
Women’s tendency to “stay the course” during market turbulence represents a disciplined approach that prevents the panic selling and impulsive buying that typically destroys long-term returns.
Performance Analytics: Quantifying Superior Returns
While these percentage differences may appear modest, compound interest transforms consistent outperformance into substantial wealth differentials over investment horizons of decades.
Compound Impact of Performance Differences
Investment Growth Over 30 Years ($100,000 Initial)
Men’s Returns
$532K
7% Annual Return
Women’s Returns
$761K
8% Annual Return
Difference
$229K
43% More Wealth
Small performance differences create massive wealth gaps over time
This data reveals that women demonstrate superior decision quality, achieving disproportionately higher success rates despite substantially lower participation volumes.
Quality Over Quantity: Forex Trading Success
100%
All Traders
9.7%
Women Traders
10.7%
Profitable Picks
9.7%
Women Traders
10.7%
Profitable Picks
8.7%
Share of Losses
Women outperform in profitability despite lower participation
When forced-choice questions eliminate the “don’t know” option, gender performance gaps disappear, suggesting women possess equivalent knowledge but exhibit greater intellectual humility.
The Confidence vs. Competence Gap
Self-Assessed Knowledge
Men71%
Women54%
High Investing Knowledge
Actual Performance
Men85%
Women84%
Correct Answers (No “Don’t Know”)
≈ 1%
Actual Knowledge Gap
When survey methodology removes “don’t know” option
The “knowledge gap” is actually a confidence gap
Market Psychology: Overconfidence and Risk Assessment
Traditional behavioral finance theory attributes male trading frequency to overconfidence bias. However, recent experimental research by Cueva et al. challenges this simplified explanation, finding that confidence differences don’t fully account for trading behavior disparities. This suggests multiple factors—including biological predispositions, competitive instincts, and variations in risk tolerance—contribute to observed behavioral patterns.
Research on MBA students revealed significant correlations between testosterone levels and risk aversion, with gender differences in risk tolerance disappearing when comparing individuals with similar hormone concentrations. This finding implies that both biological and psychological factors influence investment behavior. [18]
Strategic Implications for Financial Services
The evidence suggests financial institutions should fundamentally reconsider their approach to gender-based marketing and education. Rather than encouraging women to adopt male-dominated trading patterns—which consistently produce inferior returns—the focus should shift toward:
Marketing Strategy Evolution: Moving from competition-focused themes toward long-term, goal-oriented investment messaging that aligns with women’s demonstrated behavioral advantages.
Educational Program Restructuring: Building confidence rather than basic knowledge transfer, utilizing interactive tools that encourage decisive action based on existing competency.
Advisory Service Enhancement: Providing personalized, trust-based guidance that acknowledges distinct goals and preferences while leveraging successful female role models to create relatable market engagement.
Future Market Dynamics
Current demographic trends suggest a fundamental shift in financial market participation. As younger women continue demonstrating superior investment behaviors while achieving unprecedented capital access, traditional gender wealth gaps appear likely to narrow significantly over the coming decades.
For individual investors regardless of gender, the data provides clear guidance: consistent profitability derives from discipline, patience, and long-term perspective rather than excessive trading activity or high-risk speculation. The most effective investment strategy emphasizes precision over volume, focusing on risk-adjusted returns rather than raw performance metrics.
Conclusion: Redefining Investment Excellence
The gender gap in trading participation reveals an uncomfortable truth about financial markets: increased activity frequently correlates with decreased performance. As the investment industry grapples with this reality, the evidence suggests that successful investing may increasingly adopt characteristics traditionally associated with women’s market engagement—patience, discipline, and strategic long-term thinking.
The future of investment success favors quality over quantity, strategy over speculation, and evidence-based decision-making over confidence-driven activity.
Pocket Option AI Trading Stocks… 100% Accurate? | Live Test & Results
Is Pocket Option AI Trader a Scam? Testing with Currencies (Full Review)
How to Make Money on Quotex Using Simple Strategies
Pocket Option AI Trading Put to the Test with Real Trades (70% Profits?)
Quotex Review 2025 – Is It Still Worth Using
The New Wall Street War: AI vs Human Traders – Who Really Wins in Different Markets?
Executive Summary
A comprehensive new study analyzing trading performance from 2022-2024 reveals that the age-old question of “man versus machine” in financial markets isn’t about finding a winner—it’s about understanding when each approach excels and how their collaboration could reshape Wall Street forever.
Market Cycle Performance Comparison
+0.92
AI Bear Market
-12.74
Human Bear Market
2.21
Human Bull Market
1.88
AI Bull Market
Sharpe Ratio and Jensen’s Alpha measurements across market cycles
The Verdict: Context Matters More than Technology
The trading floor revolution that began with Richard Donchian’s automated rules in 1949 has reached an inflection point. After analyzing performance data across multiple market cycles, researchers found that artificial intelligence and human traders each dominate in distinctly different environments.
The landscape of financial trading has fundamentally shifted from manual, floor-based activities to a sophisticated, data-driven ecosystem. But the central inquiry isn’t a simple binary of “man versus machine”—it’s a nuanced exploration of distinct performance profiles, strategic methodologies, and inherent vulnerabilities.
Market Performance Data: The Numbers Tell the Story
Fund Performance Across Market Cycles (2022-2024)
Time Period
Market Condition
AI Fund Performance
Human Fund Performance
Winner
2022
Bear Market
Jensen’s Alpha: +0.92
Jensen’s Alpha: -12.74
AI Funds
2023
Recovery Phase
Sharpe Ratio: 2.38
Sharpe Ratio: 2.41
Near Tie
2024
Bull Market
Sharpe Ratio: 1.88
Sharpe Ratio: 2.21
Human Funds
AI vs Human — Trading Capabilities
A quick, modern snapshot comparing speed, scale, emotion, and adaptability.
⚡Speed Comparison
Human
Hours
AI
Milliseconds
Human total timeAI total time
📊Data Processing
Human
20–30 stocks/day
AI
Millions/second
🧠Emotional Control
Human
⚠️ Fear⚠️ Greed⚠️ Panic
AI
✅ Objective✅ Consistent✅ Rule‑based
🧭Adaptability
Human
✅ Intuition✅ Context✅ Black‑swan sense
AI
⚠️ Novel regimes⚠️ Data drift⚠️ Unseen events
Key Performance Statistics
60% – AI prediction accuracy vs. 53-57% for human analysts (University of Chicago study)
10.1% – Returns for AI-powered hedge funds in H1 2023 vs. 5% for traditional funds
2-6% – Increase in NYSE pricing errors when human floor trading stopped during pandemic
20-30 – Maximum stocks human analysts can review daily vs. millions for AI systems
The Capability Matrix: Where Each Approach Dominates
Comparative Strengths and Weaknesses
Capability
Human Traders
AI Traders
Advantage
Speed
Minutes to hours
Milliseconds to microseconds
AI
Data Processing
20-30 stocks per day
Millions of data points per second
AI
Emotional Control
Prone to fear, greed, panic
Completely objective
AI
Adaptability
Excellent with black swan events
Struggles with unprecedented situations
Human
Analysis Type
Qualitative, contextual insight
Quantitative, pattern recognition
Human
Market Conditions
Bull markets, growth phases
Bear markets, high-frequency trading
Context-Dependent
Processing Power Comparison
20-30
Stocks/Day
Human Capacity
VS
Millions
Data Points/Second
AI Capacity
Human Trader Archetypes and Strengths
Human traders fall into distinct categories that reveal varied decision-making approaches:
Discretionary Traders: Rely on personal judgment, experience, and intuition—the “Bruce-Lee-philosophy trader” who adapts fluidly to market conditions.
Systematic Traders: Follow predefined rules while still maintaining human-designed strategies.
Core Human Advantages:
Superior ability to interpret non-quantifiable, qualitative factors
Assessment of management team competence
Understanding of geopolitical events impact
Contextual interpretation of corporate news and merger rumors
Exceptional performance in bull markets and recovery phases
Human Vulnerabilities:
Emotional bias leading to poor decision-making
Processing speed limitations
Manual execution prone to delays and errors
Psychological hurdles affecting even experienced traders
The AI Trading Arsenal: From Algorithms to Intelligence
Modern AI traders represent a sophisticated evolution from algorithmic predecessors, leveraging advanced computational power with unprecedented speed and objectivity.
Core AI/ML Models in Trading
AI/ML Model
Description
Trading Application
Supervised Learning
Learns from historical labeled data to predict outcomes
Market direction forecasting, entry point identification
Automated trading, risk management, order optimization
AI Trading System Components
A fully functional AI trading bot consists of three major components:
Data Ingestion: Continuous collection of real-time and historical data from various sources including traditional market data (OHLCV), macroeconomic indicators, and alternative data like social media sentiment.
Model Prediction Engine: Core analytical module processing ingested data through machine learning models to generate trading signals and identify opportunities.
Execution System: Automated trade execution via exchange APIs based on prediction engine signals, including risk management protocols and dynamic bid/ask spread adjustments.
The Risk Equation: Different Failures, Equal Dangers
Both AI and human trading carry significant risks that manifest in different but equally dangerous ways.
AI Risk Profile
Flash Crash Vulnerability: The 2010 Flash Crash demonstrated how High-Frequency Trading can amplify market volatility. While HFT didn’t cause the crash, it contributed by aggressively demanding immediacy during dwindling liquidity periods.
Black Swan Blindness: AI models trained on historical data struggle with rare, unpredictable events like the 2008 financial crisis or COVID-19 pandemic that defy conventional expectations.
Technical Vulnerabilities:
Overfitting to historical data
“Black box” decision-making processes
Herd-like behavior when similar models make comparable decisions
Potential for cascading algorithmic failures
Human Risk Profile
Emotional Decision-Making: The most pressing vulnerability is emotional bias—fear leading to panic selling during downturns, greed prompting irrational buying at market tops.
Psychological state affecting performance consistency
Historical Examples:
1987 stock market crash driven by emotional reactions and fear selling
Program trading amplification of human panic decisions
The Future: Hybrid Dominance and Quantamental Revolution
The most profound finding is that the future belongs not to pure AI or pure human approaches, but to powerful collaboration.
The Human-in-the-Loop (HITL) Framework
Key Components:
Strategic Oversight: Humans define high-level goals and risk parameters for AI models
Edge Case Management: Human intervention during market anomalies and unpredictable events
Validation and Control: Reviewing AI-generated recommendations and maintaining the critical “kill switch”
Performance Evidence
“Man + Machine” Success: Centaur analyst models combining human knowledge with AI outputs consistently produce the highest forecast accuracy, outperforming 57.3% of pure human forecasts and beating AI-only systems across all tested years.
Quantamental Investing Applications
Data Analysis: AI processes thousands of financial documents using machine learning for sentiment extraction while human analysts use insights for strategic decisions.
Alternative Data Integration: Human analysts leverage AI to analyze satellite images, foot traffic data, and social media sentiment to predict company earnings.
Portfolio Management: AI-powered systems automatically rebalance portfolios while human advisors focus on strategic and client-facing tasks.
The Human-in-the-Loop (HITL) Framework
Strategic Oversight
Humans define high-level goals and risk parameters for AI models
Edge Case Management
Human intervention during market anomalies and unprecedented events
Validation & Oversight
Reviewing and correcting AI recommendations to ensure accuracy
Emergency Control
Acting as the “kill switch” during algorithmic failures
Strategic Recommendations
For Individual Traders
Develop Hybrid Skills:
Learn to leverage AI-powered tools for data analysis, backtesting, and sentiment analysis
Focus cognitive resources on qualitative factors and emotional discipline
Maintain strategic planning capabilities while automating routine analysis
For Institutional Firms
Implement Robust HITL Systems:
Invest in cutting-edge AI technology alongside human analyst training
Establish clear risk controls and accessible kill switches
Ensure human oversight at critical decision points
Maintain regulatory compliance and audit capabilities
The Quantamental Revolution: The most successful trading strategies now blend quantitative AI capabilities with fundamental human analysis. “Man + machine” models outperform 57.3% of pure human forecasts and beat AI-only systems consistently.
Human-in-the-Loop (HITL) Framework
Strategic Oversight
Humans set goals and risk parameters
Edge Case Management
Human intervention during anomalies
Validation & Control
Review AI decisions and maintain kill switch
Strategic Recommendations
For Individual Traders
Develop hybrid skills: leverage AI tools for data analysis while focusing on qualitative factors and emotional discipline
For Institutions
Implement robust Human-in-the-Loop systems with clear risk controls and accessible kill switches
Looking Forward: Technological Evolution
The next wave of innovations will further reshape trading:
Generative AI: Advanced automation of financial report generation and forecasting
Quantum Computing: Revolutionary improvements in risk modeling and optimization
Regulatory Challenges: Need for “quantum-resistant cryptography” to secure financial data
Market Stability: Balancing technological innovation with regulatory oversight
The Bottom Line
The future of trading isn’t about replacing humans with machines or vice versa—it’s about creating a symbiotic relationship that leverages AI’s computational power and speed with human strategic oversight and adaptability.
The data clearly shows that neither approach is universally superior. AI excels at disciplined loss mitigation during bear markets, while humans demonstrate superior ability to capture upside momentum and growth opportunities during bull markets.
As generative AI and quantum computing continue to evolve, this collaborative model will likely become the industry standard for maximizing returns while managing the unique risks that both approaches bring to the table.
The war between AI and human traders is over. The collaboration has just begun.
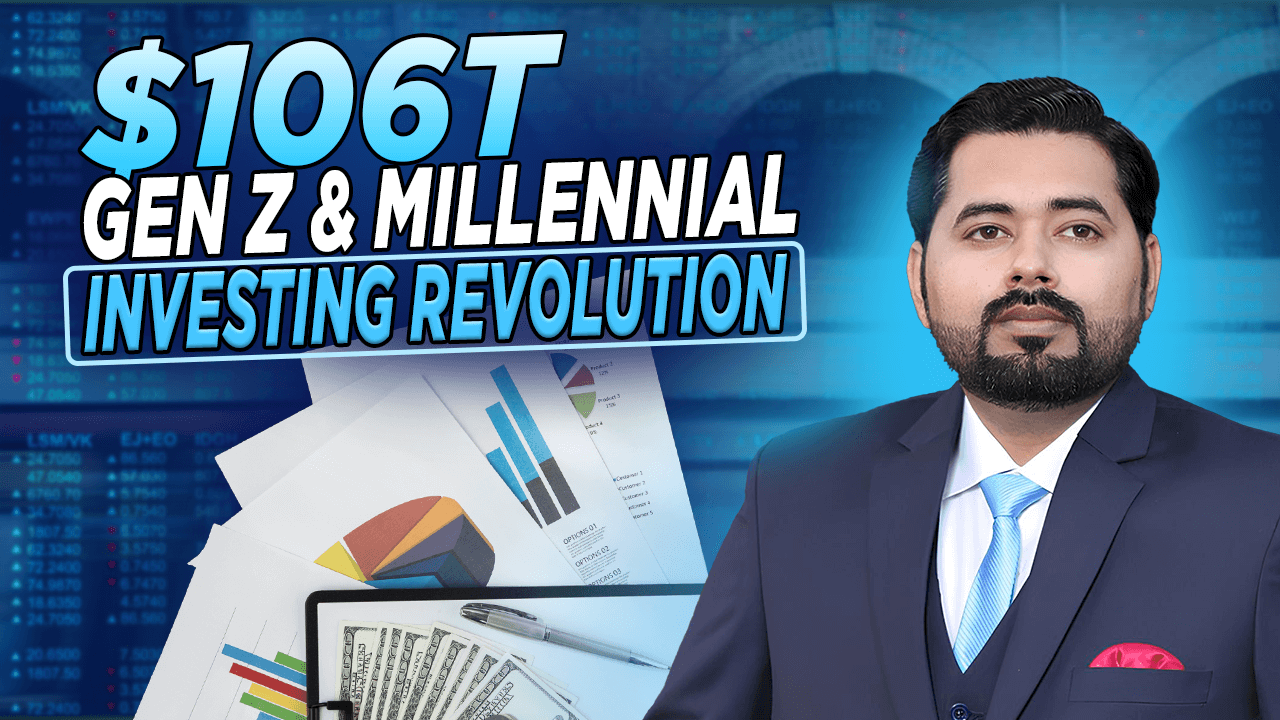
The $106 Trillion Revolution: How Gen Z and Millennials Are Rewriting Investment Rules
Young Americans are driving a seismic shift in financial markets, embracing crypto and ESG while fleeing expensive coastal cities
The Investment Paradox Driving a Generation
Forget the stereotypes about financially irresponsible young adults. America’s newest wave of investors, Generation Z and Millennials, are saving money at nearly twice the rate of Baby Boomers while fundamentally reshaping what it means to build wealth.
This generation represents a massive economic force: Gen Z accounts for 12% of all U.S. investors, while Millennials make up 25%. But here’s what makes them different: they’re operating under a central paradox that’s driving unprecedented market behavior. Despite facing crushing financial anxiety, 61% of 18-to-35-year-olds reported financial stress in 2025; they remain remarkably optimistic about their wealth-building prospects.
The numbers tell the story of their urgency. Over 40% of Gen Z and Millennials increased their savings in the past year, compared to just 22% of Baby Boomers. This isn’t casual financial planning, it’s strategic preparation for an economic reality where traditional paths to wealth feel increasingly out of reach.
The Financial Reality Check
Current Financial Pressures Facing Young Investors
Primary Concern
Percentage Affected
Rising living expenses
76%
Job uncertainty
48%
Increasing housing costs
46%
Source: 2025 financial anxiety survey of 18-35 year-olds
📊 The Investment Generation: By the Numbers
12%
Gen Z Share of All US Investors
25%
Millennial Share of All US Investors
$106T
Wealth Transfer by 2048
The debt landscape reveals another generational divide. Millennials carry an average of $33,000 in student loan debt, while Gen Z—having witnessed the struggles of their predecessors—limited their student borrowing to an average of $20,000. This debt awareness translates into action: Gen Z starts saving for retirement at a median age of 19, contributing 20% of their annual pay.
Despite starting from behind financially, their optimism is striking. Some 43% of Gen Z and 42% of Millennials believe they will achieve wealth or already have, compared to just 20% of Baby Boomers who feel the same way.
Average Retirement Savings by Generation
Generation
Average 401(k) Balance
Average IRA Balance
Baby Boomers
$249,300
$257,002
Gen X
$192,300
$103,952
Millennials
$67,300
$25,109
Gen Z
$13,500
$6,672
Source: Fidelity Investments Q4 2024
💰 Retirement Savings: The Generational Gap
Baby Boomers
$249K
Average 401(k)
Gen X
$192K
Average 401(k)
Millennials
$67K
Average 401(k)
Gen Z
$13K
Average 401(k)
Breaking From Traditional Investment Playbooks
Young investors have reached a definitive conclusion: the old rules don’t work anymore. A Bank of America study found that 72% of investors between 21 and 43 believe “it’s no longer possible to achieve above-average returns solely with traditional stocks and bonds.”
This philosophy is driving them toward dramatically different asset classes. Cryptocurrency ownership among young Americans dwarfs older generations, with 51% of Gen Z and 49% of Millennials currently or previously owning digital assets. By contrast, only 29% of Gen X and 9% of Baby Boomers have ventured into crypto markets.
Investment Asset Ownership Across Generations
Asset Class
Gen Z/Millennials
Gen X/Baby Boomers
Individual Stocks
Most common holding
Most common holding
Cryptocurrency
51% (Gen Z), 49% (Millennials)
29% (Gen X), 9% (Boomers)
ETFs
75% (Gen Z), 81% (Millennials)
60% (Boomers)
ESG Stocks
More likely to own
Less likely to own
AI/Gaming Stocks
More likely to hold
Less likely to hold
Private Equity Interest
26% (Millennials)
15% (older investors)
The appeal of crypto isn’t just about potential returns—it represents a philosophical shift. Young investors view digital assets as both an inflation hedge and a challenge to centralized financial systems. Interestingly, while 29% of investors avoid stocks due to lack of understanding, only 24% say the same about crypto, suggesting that digital natives find cryptocurrency more intuitive than traditional markets.
🚀 Cryptocurrency Adoption: The Digital Divide
51%
Gen Z
49%
Millennials
29%
Gen X
9%
Boomers
Percentage who currently own or have owned cryptocurrency
Values-Driven Investment Strategies
Environmental, Social, and Governance (ESG) investing has become a cornerstone of young investor portfolios. Among wealthy young investors, 82% consider a company’s ESG record when making investment decisions, compared to just 35% of their older counterparts.
This extends to thematic investing in sectors like artificial intelligence and gaming, where young investors see both growth potential and alignment with their technological worldview. The recent resurgence of meme stock phenomena has also evolved, shifting from nostalgia plays like GameStop to culturally relevant consumer brands often promoted by social media influencers.
The Digital Influence Ecosystem
Social media’s role in investment decisions is more nuanced than headlines suggest. While 19% of young investors say social media influences their decisions—nearly double the rate of all investors—their most trusted source remains family and parents. This challenges the narrative of a generation making reckless decisions based solely on “finfluencers.”
The Fear of Missing Out (FOMO) does drive some impulsive behavior, but their risk-taking isn’t naive. Gen Z views almost all assets as riskier than older generations—a perception shaped by entering markets during high inflation and economic uncertainty. Their aggressive investment choices appear to be calculated responses to an environment where conservative strategies feel insufficient.
Technology adoption extends to financial management, with 41% of Gen Z and Millennials willing to let AI assistants manage their investments, compared to just 14% of Baby Boomers.
🤖 AI Investment Management Acceptance
41%
Gen Z & Millennials
Willing to use AI for investing
VS
14%
Baby Boomers
Willing to use AI for investing
The Great Migration: Following the Money
While comprehensive state-by-state trading data remains limited, demographic patterns reveal a significant geographic shift. Young investors are abandoning expensive coastal markets for affordable growth cities in the Midwest and South.
Millennial Home Buying Patterns by Metro Area (2024)
Metro Area
% of Millennials Who Bought Homes
Median Millennial Income
Median Property Value
Top Markets
Raleigh-Cary, NC
4.50%
$138,000
$455,000
Indianapolis, IN
4.32%
$103,000
$325,000
Charlotte, NC-SC
4.28%
$125,000
$425,000
Nashville, TN
4.08%
$123,000
$455,000
Cincinnati, OH-KY-IN
4.06%
$107,000
$315,000
Lowest Markets
San Francisco, CA
0.52%
$331,500
$1.565 million
New York City, NY
0.76%
Data not available
Data not available
Miami, FL
0.94%
Data not available
Data not available
Source: SmartAsset 2024
🏠 The Great Migration: Where Millennials Are Buying Homes
🏆
TOP MARKETS
4.50%
Raleigh-Cary, NC
📉
LOWEST MARKETS
0.52%
San Francisco, CA
📊 Regional Home Buying Comparison
Market
Buying Rate
Median Income
🔥 Raleigh-Cary, NC
4.50%
$138K
🔥 Indianapolis, IN
4.32%
$103K
🔥 Charlotte, NC-SC
4.28%
$125K
❄️ San Francisco, CA
0.52%
$332K
❄️ New York City, NY
0.76%
N/A
❄️ Miami, FL
0.94%
N/A
This migration represents a mass economic arbitrage, with remote work enabling young professionals to achieve homeownership that would be financially impossible in traditional hubs. The long-term implications for local economies and investment patterns could be profound.
The $106 Trillion Question
All of this investment activity is a prelude to the largest wealth transfer in American history. An estimated $106 trillion will pass from Baby Boomers to younger generations by 2048. However, there’s a concerning expectation gap: 57% of young investors expect to receive an inheritance, but 31% of older investors are unsure they’ll be able to leave one, largely due to concerns about long-term care costs.
This disconnect could intensify the financial pressure already driving young investors toward riskier, non-traditional assets. It also underscores why this generation feels compelled to take investing into their own hands rather than relying on traditional wealth-building timelines.
⚠️ The Inheritance Expectation Gap
57%
Young Investors
Expect to receive inheritance
≠
31%
Older Investors
Unsure about leaving inheritance
The Gap: Long-term care costs making inheritance uncertain
The Education Paradox
Despite their proactive investment approach, many young adults never received formal financial education, making critical decisions about student loans and credit cards without guidance. Studies of teens who completed investing courses show they prioritize learning balance sheet analysis and income statement evaluation over trendy investment strategies—suggesting a hunger for fundamental knowledge that current educational systems aren’t providing.
What This Means for Markets
The investment behaviors of Gen Z and Millennials signal more than generational preferences—they represent a structural shift that will define markets for decades. Their embrace of digital assets, values-driven investing, and technology-enabled portfolio management is already reshaping financial services.
As they gain wealth and influence, expect continued growth in cryptocurrency adoption, ESG investing, and fintech platforms. Their geographic dispersion could also redistribute economic activity away from traditional financial centers, potentially creating new regional investment hubs.
The question isn’t whether traditional financial institutions will adapt to serve these investors—it’s how quickly they can evolve to meet the demands of a generation that’s already rewriting the rules of wealth building.
Top 5 Indicators to Get an 80% Win Rate on Pocket Option
How I Recovered a $600 Loss in 3 Trades (Psychology + Setup)
Manage Consent
We use cookies to store and access device data. Consent lets us process browsing behavior or unique IDs. Without it, some features may not work properly.
Functional
Always active
The technical storage or access is strictly necessary for the legitimate purpose of enabling the use of a specific service explicitly requested by the subscriber or user, or for the sole purpose of carrying out the transmission of a communication over an electronic communications network.
Preferences
The technical storage or access is necessary for the legitimate purpose of storing preferences that are not requested by the subscriber or user.
Statistics
The technical storage or access that is used exclusively for statistical purposes.The technical storage or access that is used exclusively for anonymous statistical purposes. Without a subpoena, voluntary compliance on the part of your Internet Service Provider, or additional records from a third party, information stored or retrieved for this purpose alone cannot usually be used to identify you.
Marketing
The technical storage or access is required to create user profiles to send advertising, or to track the user on a website or across several websites for similar marketing purposes.