9 Best Pocket Option Candlestick Patterns (With Real Trading Examples)
")
I’ll never forget the first time I stared at a Pocket Option chart, clueless about what all those candlesticks meant. It looked like a strange language, green and red bars moving up and down without warning. I took a few trades based on gut feeling.
Spoiler: I lost.
That’s when I realized I needed to learn candlestick patterns. Not just memorize them, but understand what they mean. And once I did, everything changed. My win rate improved. My confidence soared. No more second-guessing. Now I will show you the exact candlestick patterns that helped me level up on Pocket Option.
Want to test these patterns risk-free?
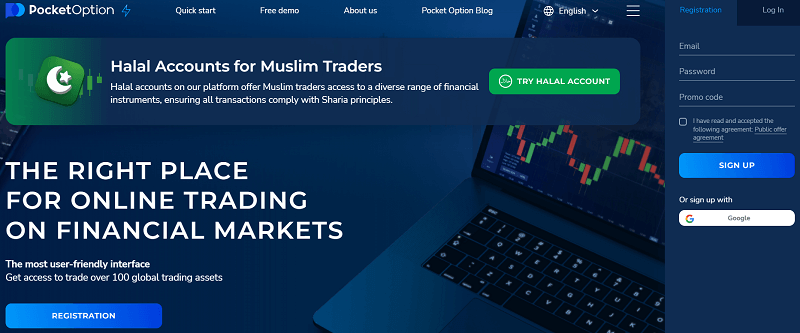
Open your free Pocket Option demo account and get $10,000 in virtual funds. It’s the easiest way to learn candlestick trading before going live, no deposit required.
These aren’t just textbook definitions. I’ll walk you through how each plays out in real trades and what to watch for. Finally, I’ve included a downloadable cheat sheet you can use as a quick visual guide during live trading.
Let’s start with the candlestick basics; then dive into the patterns.
Quick Comparison: Best Pocket Option Candlestick Patterns
If you’re short on time, here is a quick overview of the most effective candlestick patterns for Pocket Option trading.
| Pattern | Signal Type | Reliability | Best Timeframe |
|---|---|---|---|
| Pin Bar | Reversal | High | 30s–5m |
| Engulfing | Reversal | Very High | 1m–5m |
| Doji | Indecision | Medium | 1m–5m |
| Morning Star | Reversal | High | 1m–5m |
| Three White Soldiers | Continuation | High | 1m–5m |
| Tweezer Top/Bottom | Reversal | High | 30s–2m |
| Marubozu | Momentum | High | 30s–5m |
| Inside Bar | Breakout | Medium | 1m–5m |
| Fakeout Wick | Reversal | High | All |
Beginners should focus on Pin Bars, Engulfing Patterns, and Morning Stars first. These tend to be easier to recognize and more reliable when combined with support and resistance levels.
Why Candlestick Patterns Matter on Pocket Option
Unlike longer-term trading, binary options give you just seconds or minutes to decide. So patterns that give you even a slight edge matter a lot. Candlesticks show real-time price psychology. They reveal who’s in control, the buyers or the sellers, and what might happen next.
But here’s what most articles don’t tell you: not every pattern is reliable on lower timeframes. Some only work in strong trends. Others are better at reversals. That’s where experience and context come in.
How Accurate Are Candlestick Patterns on Pocket Option?
Many beginners assume candlestick patterns guarantee winning trades. They don’t.
In my experience, the best Pocket Option candlestick patterns work when they appear at key support and resistance levels and align with the overall trend.
For example:
- A bullish engulfing pattern at support is stronger than one in the middle of a ranging market.
- A pin bar rejecting a major resistance level has a higher probability than a random pin bar.
- Confirmation from indicators like RSI or MACD can further improve accuracy.
No pattern is 100% accurate, but combining candlestick analysis with market structure can significantly improve decision-making.
Best Candlestick Patterns for Pocket Option Trading
I’m going to share the nine patterns I trust the most for fast Pocket Option trades. Let’s go.
1. The Pin Bar (Also known as the Hammer or Shooting Star)
This was the first candlestick that actually made me money. Picture this: I was trading EUR/USD on the 30-second chart. The market had been dropping fast. Then, out of nowhere, a tiny-bodied candle with a long lower wick formed at a support level. That was the hammer.
It meant sellers tried to push lower, but buyers snapped back firmly. I entered a quick BUY trade. Thirty seconds later, it closed in on the money.
Pin Bars show rejection. Use them at key levels or after sharp moves. They work best when:
- The wick is 2–3 times longer than the body
- The candle forms at a previous support/resistance level
- There’s a strong reaction after it closes
2. Engulfing Pattern (Bullish & Bearish)
If you only learn one pattern, let it be this. I remember spotting a bullish engulfing candle during a news spike. A green one completely swallowed the previous red candle. I placed a BUY just after it closed. That trade paid for my lunch and dinner.
Engulfing patterns are powerful reversal signals. Here’s what to look for:
- A small candle followed by a larger one of the opposite color
- The second candle “engulfs” the first entirely
- Stronger when formed after a long move
Don’t trust them in choppy markets. Wait for clear direction.
3. Doji
Dojis used to confuse me. They don’t look like much, just a cross or thin-bodied candle. But their power is in their indecision.
I once saw a doji form after five straight green candles on USD/JPY. That was the signal to watch out for. A bearish candle followed, and I jumped in with a PUT.
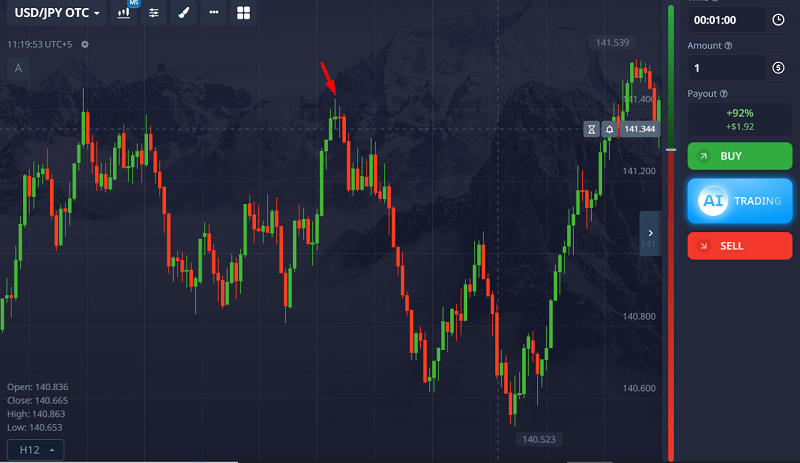
Here’s when to use Doji:
- After a strong trend (potential reversal)
- At significant resistance or support
- Only when followed by confirmation (like an engulfing or strong opposite candle)
4. Morning Star & Evening Star
The Morning Star saved me once when trading Gold. Price had been falling aggressively and I was tempted to keep selling. Then a classic Morning Star appeared:
strong red candle → small indecision candle → strong green candle.
The pattern signaled that sellers were losing control and buyers were stepping in. I entered a CALL trade after confirmation and caught the reversal.
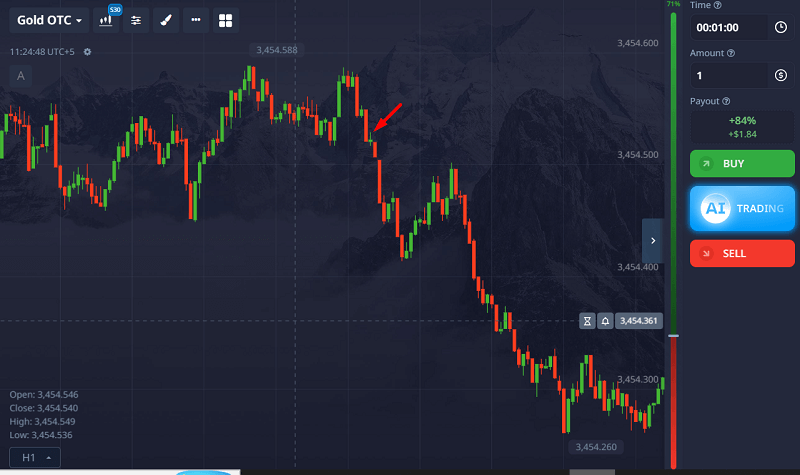
How to spot them:
- Morning Star: Red → Small candle → Green
- Evening Star: Green → Small candle → Red
- Look for the middle candle to “gap” slightly and be small
- Best on 1-min or 2-min timeframes
5. Three White Soldiers & Three Black Crows
These patterns scream momentum. Buyers are in charge when you see three strong green candles in a row (White Soldiers). Three strong red ones (Black Crows)? Get ready for more downside.
I often use this to catch a second or third wave of a trend. For example, on a USD/CAD rally, I saw three white soldiers form and waited for a slight pullback before hitting a CALL. It was a clean win.
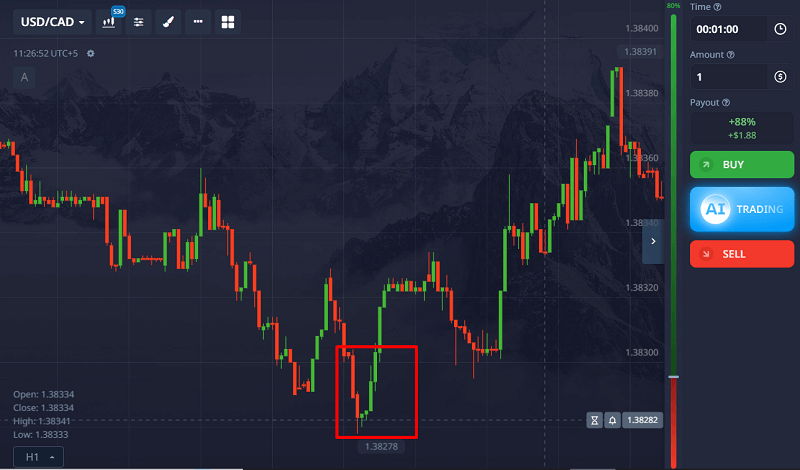
Watch for:
- Similar-sized candles
- Small or no wicks
- Trend continuation rather than reversal
You can use this as a one-minute strategy as well.
Ready to apply these patterns in real trades?
Get a 50% bonus on your first Pocket Option deposit and start practicing with a solid plan. Combine this with our candlestick cheat sheet for better setups and stronger signals.
6. Tweezer Tops & Bottoms
These are subtle but deadly accurate when used correctly. I like them for scalping reversals on short-term charts.
A Tweezer Top is two candles with equal highs, usually after an uptrend. Tweezer Bottom? Equal lows after a drop.
Once, I caught a perfect Tweezer Bottom on EUR/GBP with both candles having matching wicks. I waited for a small green candle to confirm, and the price bounced.
Ideal setup:
- Two or more candles with matching highs/lows
- Wick rejection is key
- Works best with RSI/MACD divergence
7. Marubozu
This one has no wick. Just a solid block. When you see it, take notice.
A green Marubozu shows strong buying, no hesitation. Red means heavy selling. I used to fade these, thinking they were “too late” to trade. Wrong. Often, they start a bigger move.
Now, I either ride the momentum, wait for a tiny pullback, and then enter. This strategy is especially powerful after news events.
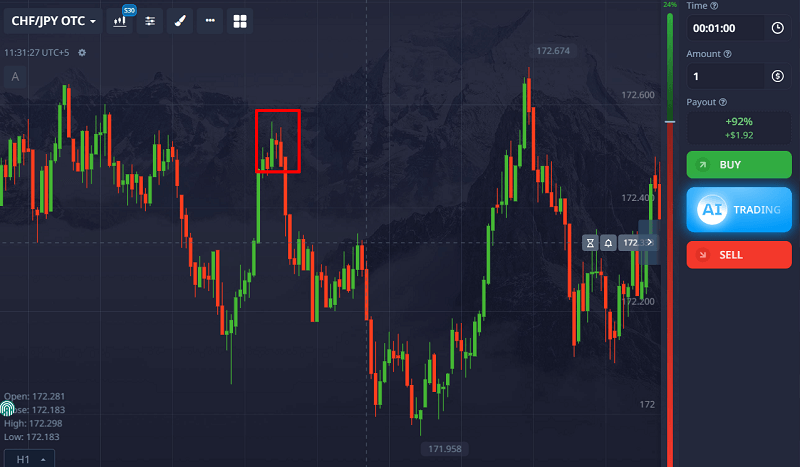
8. Inside Bar
The Inside Bar tells you a big move is coming. It’s a pause before the storm.
This works best on 1 to 5 minute charts. When I spot one, I draw a mini box around it and wait for a breakout. If the following candle breaks above, I will call. If it breaks below, I put.
Tips:
- Inside Bar is smaller and fits within the high/low of the previous candle
- Works well after strong moves or at key levels
- Avoid sideways markets
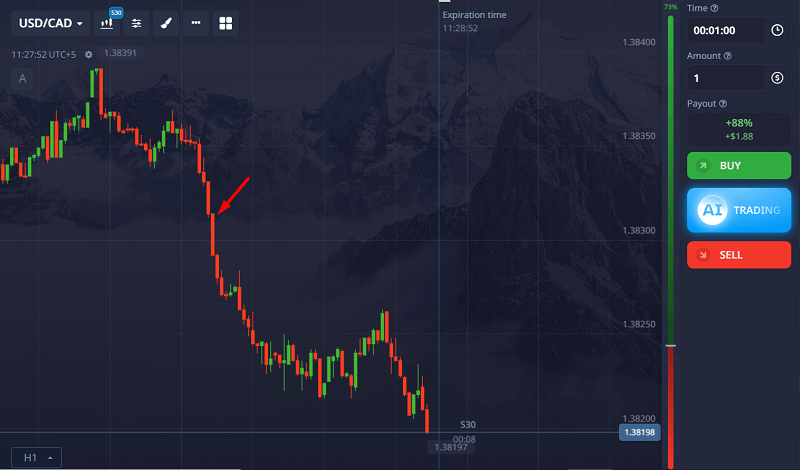
9. The Fakeout Wick
Okay, this one’s not in most guides, but it should be. I call it the “fakeout wick.” You’ll see a long wick pierce a level and then snap back. It looks like a breakout, but it’s a trap.
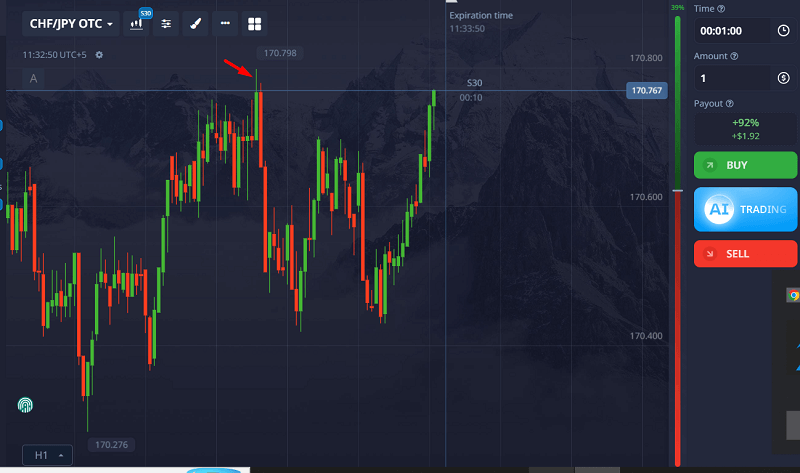
I’ve been caught in a few. But now I use it to my advantage. When I see a long wick that breaks a level but fails, I enter in the opposite direction, right after a confirmation candle.
Look for:
- Wick is at least 2x body length
- Price quickly reverses
- Works at daily highs/lows or psychological levels
Common Candlestick Pattern Mistakes Beginners Make
Learning candlestick patterns is only half the battle. Here are the mistakes I see beginners make most often:
Trading Every Pattern
Not every setup is worth taking. Focus on quality over quantity.
Ignoring Trend Direction
Bullish patterns perform better in uptrends. Bearish patterns perform better in downtrends.
Entering Before Candle Close
Wait for the candle to fully close. Many patterns look valid midway through formation and then disappear.
Ignoring Support and Resistance
A pattern at a key level is far more reliable than one forming in the middle of nowhere.
Risking Too Much
Even the strongest candlestick setup can fail. Always manage risk carefully.
Combining Candlestick Patterns with Chart Structure
Although this guide focuses on candlestick patterns, structure still matters.
For example, a W pattern (double bottom) is technically a chart pattern. But the entry trigger often comes from a candlestick confirmation, such as a bullish engulfing or hammer at the neckline.
This is how professional traders combine price structure with candle psychology rather than relying on shapes alone.
If you want to apply this properly, practice identifying both structure and candle confirmation together.
👉 Open your Pocket Option account and test these confirmations live
Real Market Examples
After reviewing and journaling more than 200 Pocket Option trades, I noticed that the highest-probability setups consistently occurred when candlestick patterns aligned with trend direction and key support or resistance levels.
- EUR/USD 1-min chart: Tweezer Bottom at round number 1.0900 followed by engulfing green candle. CALL trade = ITM.
- GBP/JPY 2-min chart: Evening Star after news spike. PUT trade = ITM.
- Gold 30s chart: Fakeout Wick above previous high, snapped back. PUT trade = ITM.
Best Candlestick Patterns for Pocket Option Scalping
For 30-second and 1-minute trades, not every pattern performs equally.
Engulfing candles at key levels, strong pin bars, and clear momentum Marubozu candles tend to work best in fast conditions. However, market context matters more than the pattern itself.
Sideways markets reduce reliability. Strong trends increase it.
If you’re trading very short expiries, reduce noise by:
- Waiting for candle close
- Trading at clear levels
- Avoiding overtrading
Consistency comes from patience, not frequency.
Candlestick Patterns Ranked by Reliability (Pocket Option)
The reliability of a candlestick pattern depends heavily on context, timeframe, and market conditions. However, based on short-term binary trading behavior (1–5 minute charts), here’s how they generally rank when used correctly.
| Rank | Pattern | Pattern Type | Market Signal | Reliability (Short-Term) | Best Used In |
|---|---|---|---|---|---|
| 1 | Engulfing (Bullish/Bearish) | Reversal / Continuation | Momentum Shift | ⭐⭐⭐⭐⭐ High | Pullbacks in strong trends |
| 2 | Pin Bar (Hammer / Shooting Star) | Reversal | Rejection at Key Level | ⭐⭐⭐⭐ High | Support & Resistance zones |
| 3 | Morning Star / Evening Star | Reversal (3-candle) | Trend Exhaustion | ⭐⭐⭐⭐ High | After extended moves |
| 4 | Marubozu | Continuation / Breakout | Strong Conviction | ⭐⭐⭐ Medium-High | Breakouts & momentum trades |
| 5 | Double Wick Rejection | Reversal | Level Exhaustion | ⭐⭐⭐ Medium | Range boundaries |
| 6 | Inside Bar | Consolidation / Breakout | Volatility Compression | ⭐⭐ Medium | Trend continuation setups |
| 7 | Doji | Indecision | Momentum Pause | ⭐ Low (needs confirmation) | Early reversal warning |
Pocket Option Candlestick Cheat Sheet
Use this quick-reference guide during live trading.
| Pattern | Signal | Typical Action |
|---|---|---|
| Hammer | Bullish | CALL |
| Shooting Star | Bearish | PUT |
| Bullish Engulfing | Bullish | CALL |
| Bearish Engulfing | Bearish | PUT |
| Morning Star | Bullish | CALL |
| Evening Star | Bearish | PUT |
| Tweezer Bottom | Bullish | CALL |
| Tweezer Top | Bearish | PUT |
| Marubozu | Momentum | Trade with direction |
Remember that confirmation and market context matter more than the pattern itself.
Final Thoughts
I’m not saying candlestick patterns are magic. You still need risk management, timing, and practice. But they gave me clarity when I was drowning in confusion.
Use them with trendlines, support/resistance, and a simple indicator like RSI. Start slow. Focus on 1 or 2 patterns first. And always test them in a demo before going live.
Because in binary options, seconds matter. And when you recognize what price is saying through candlesticks, you trade smarter, not harder.
Want to master candlestick trading on Pocket Option?
Start with the demo account here and when you’re ready, claim your 50% deposit bonus to begin live trading with a head start. Learn smarter. Trade better.
FAQs
What are the best candlestick patterns for Pocket Option?
The most reliable ones include Pin Bars, Engulfing, Morning/Evening Star, and Tweezer Tops/Bottoms. Use them with context and confirmation.
Do candlestick patterns work on 30-second charts?
Yes, but only the stronger ones like Engulfing, Pin Bars, and Marubozu. Look for confluence and volume.
How can I quickly learn candlestick patterns?
Use visual cheat sheets and replay your trades. Focus on 1-2 patterns a week. Practice on the demo and take screenshots.
Can I use indicators with candlestick patterns?
Absolutely. Try combining RSI or MACD with patterns for more accurate entries.
When do candlestick patterns fail?
They often fail in sideways or low-volume markets and when used without context, such as support/resistance or trend.
Which candlestick pattern is most accurate on Pocket Option?
Bullish and bearish engulfing patterns are generally among the most reliable because they show a clear shift in market momentum. Their accuracy improves significantly when they appear at support or resistance levels.
What is the best timeframe for candlestick trading on Pocket Option?
Most traders prefer 1-minute to 5-minute charts because they provide a balance between signal quality and trading opportunities.
Do professional traders use candlestick patterns?
Yes. Many professional traders use candlestick analysis as part of a broader price action strategy alongside support and resistance, trend analysis, and volume.
How many candlestick patterns should beginners learn?
Start with just two or three patterns, such as Pin Bars, Engulfing Patterns, and Morning Stars. Mastering a few setups is more effective than trying to memorize dozens.
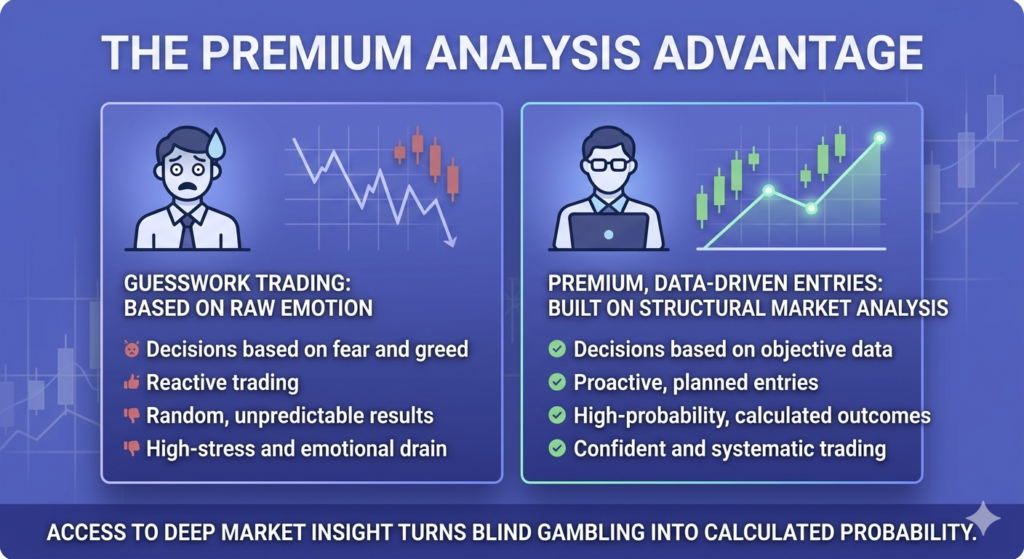
Moving Beyond Guesswork: The Ultimate Edge
If there is one thing my journey has taught me, it is that low-risk trading is not about avoiding losses entirely. It is about making sure that when you do lose, it is a tiny, controlled scratch rather than a fatal wound. The brokers we looked at today provide the physical toolkits to keep you safe, but the ultimate risk management tool is your own knowledge base.
To truly transform your trading from a stressful guessing game into an institutional process, you need deep, structural data analysis that goes far beyond basic retail charting. You need to understand market liquidity, institutional order flow, and underlying macroeconomic structures.
If you are ready to stop trading on pure hope and start building a real, professional edge grounded in institutional analysis, join our community of serious market students. Elevate your approach right now by subscribing to our exclusive framework on the Becoin Premium Membership Portal. Let’s build a sustainable, low-risk career together.