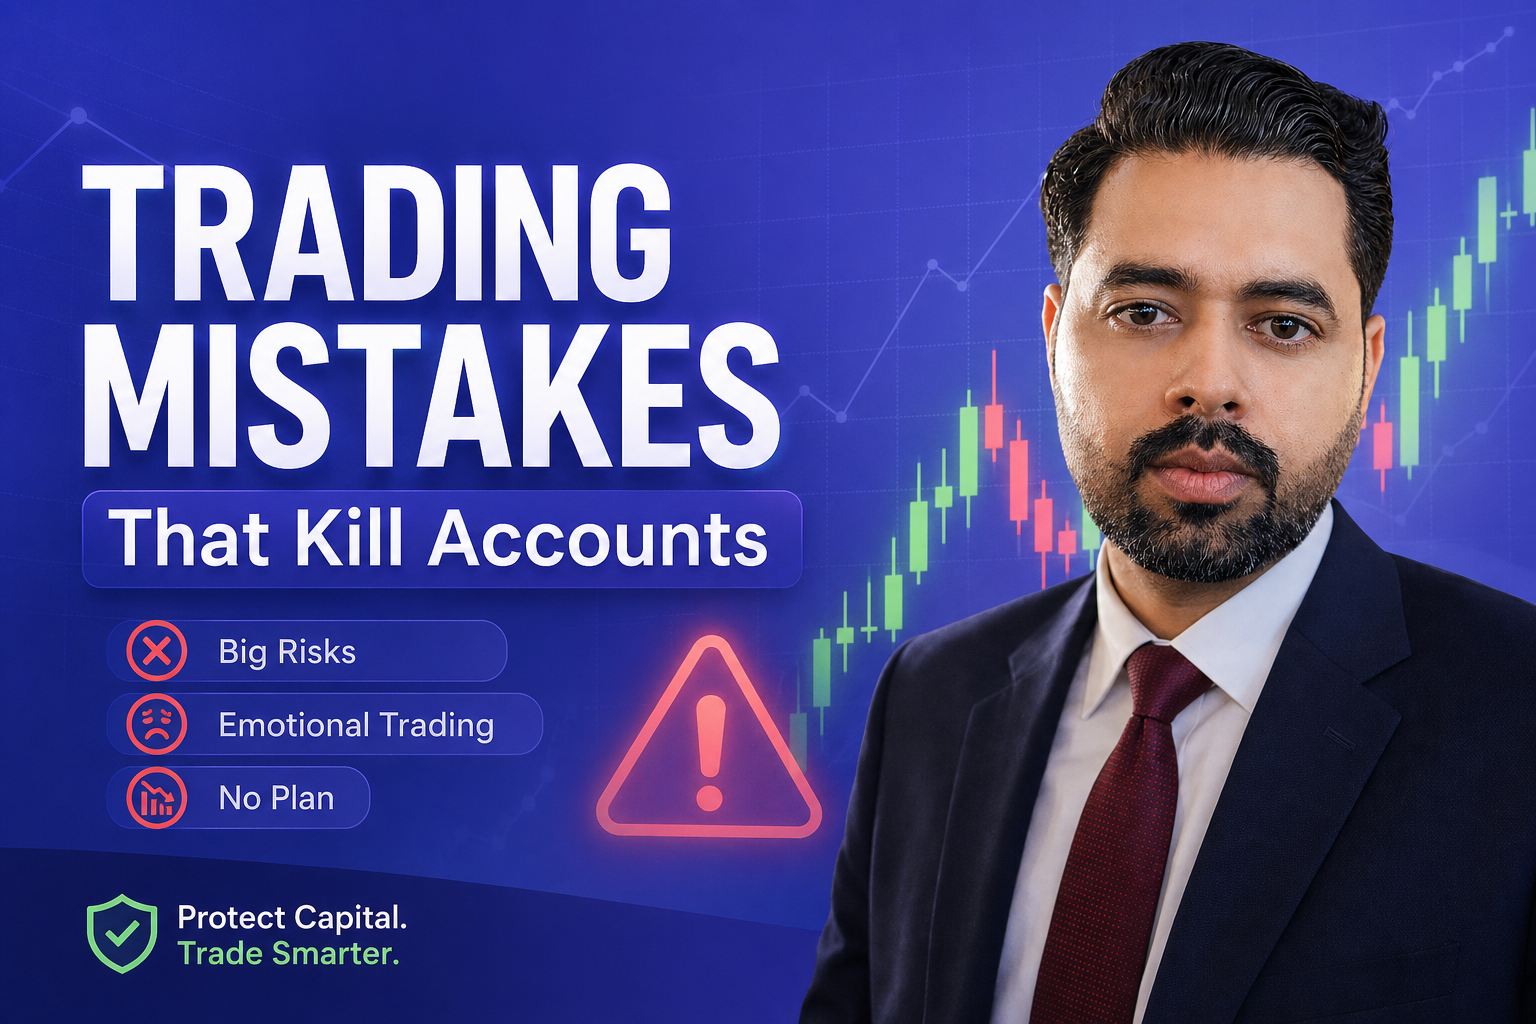
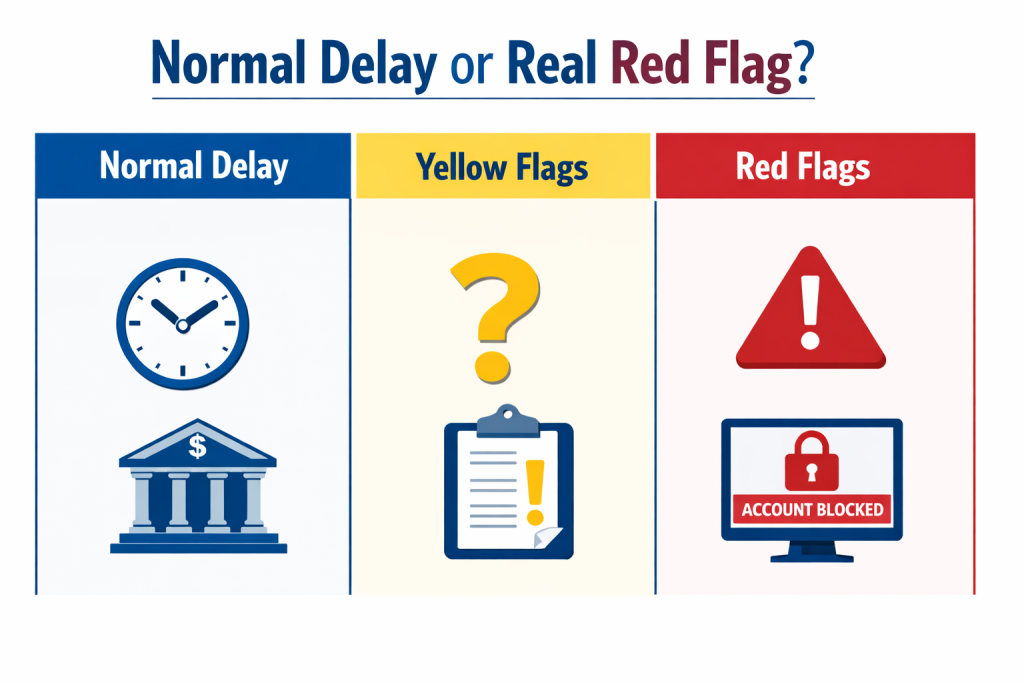
Biggest Beginner Mistakes That Kill Trading Accounts
Trading looks simple from the outside. Open an account, place a few trades, and grow your balance. But reality is different. Most beginners do not lose because markets are impossible. They lose because they repeat the same avoidable mistakes.
A small account can survive bad market conditions. What usually kills it is poor decision-making, emotional reactions, overconfidence, and weak risk control.
If you are serious about protecting your money and improving results, this guide breaks down the biggest beginner mistakes that wipe accounts out and how to avoid them.
Why Most Beginner Accounts Fail Quickly
Many new traders focus on entry signals, indicators, or finding a “winning strategy.” But before strategy matters, survival matters.
A beginner account often fails because of:
Oversized trades
Emotional revenge trading
Chasing losses
Ignoring risk management
Using poor brokers
No trading plan
Unrealistic profit expectations
If you avoid these early, you already move ahead of most beginners.
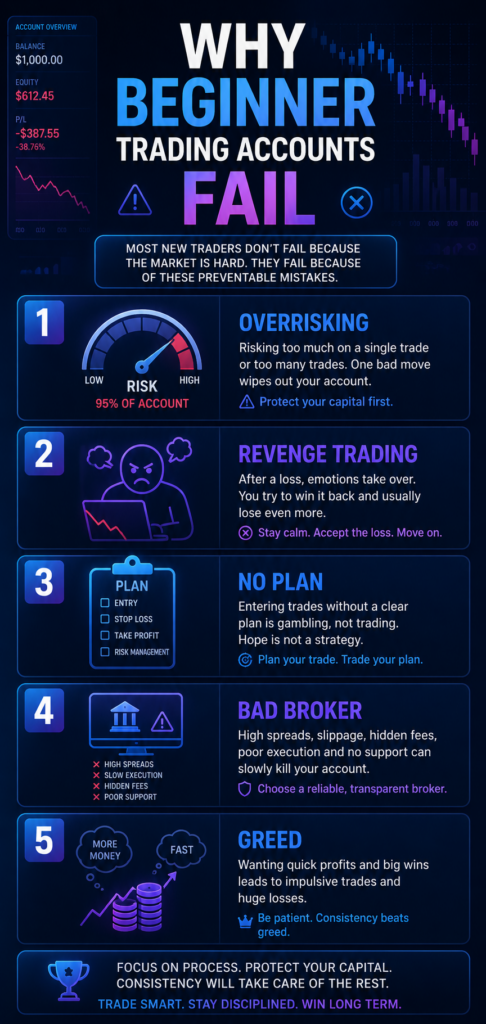
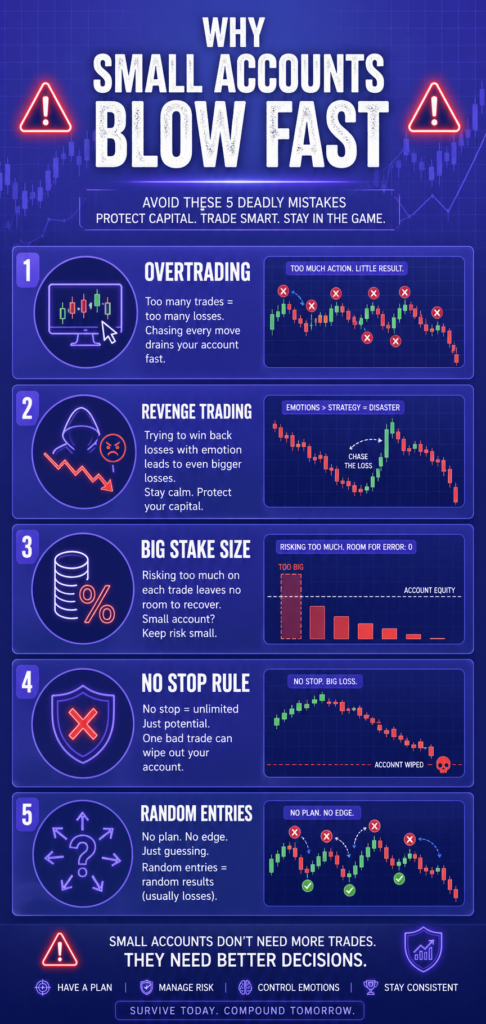
Mistake #1: Risking Too Much on One Trade
This is the fastest account killer.
A beginner deposits $20, $50, or $100 and risks 20% to 50% per trade hoping for fast growth. One losing streak can wipe out the account in minutes.
Professional traders think differently. They protect capital first.
A safer approach is risking only 1% to 3% of total balance per setup depending on experience and market conditions.
Many beginners open charts and trade based on feelings.
That creates chaos because every candle looks like an opportunity when there is no structure.
A real trading plan should define:
What setups you trade
What timeframes you use
Maximum daily risk
When to stop trading
Target reward vs risk
Session times
Without rules, emotions become the strategy.
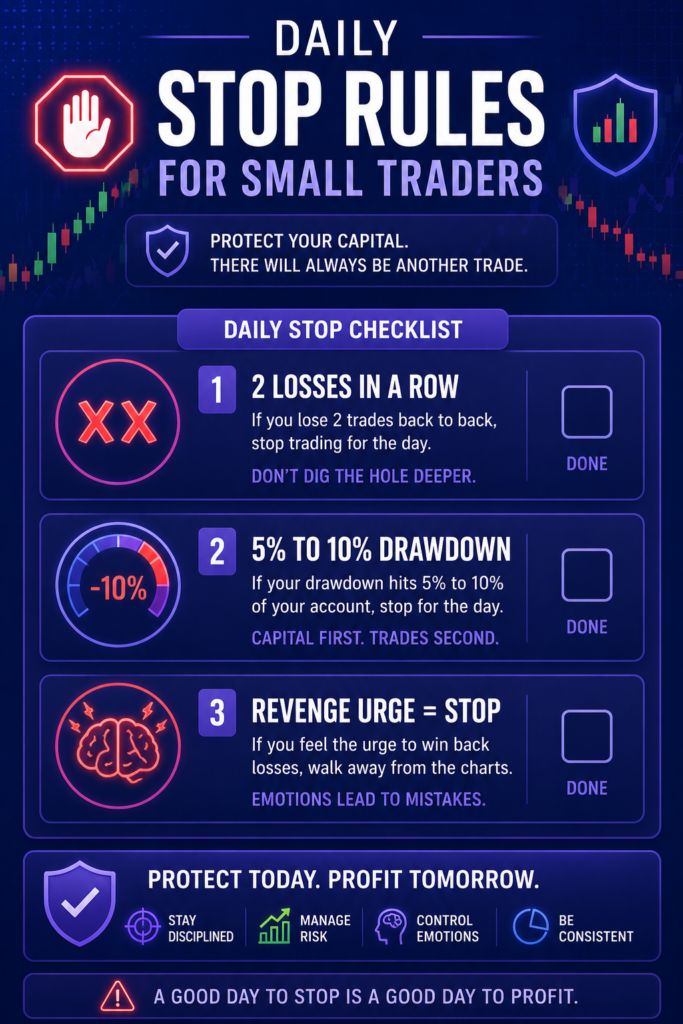
Mistake #3: Revenge Trading After a Loss
This happens when a trader loses one trade and immediately places another to “win it back.”
That second trade is usually impulsive, poorly timed, and oversized.
Losses are normal in trading. Emotional reactions are what make them dangerous.
When you lose:
Step away for 10 minutes
Review whether the setup was valid
Reduce size or stop for the day if tilted
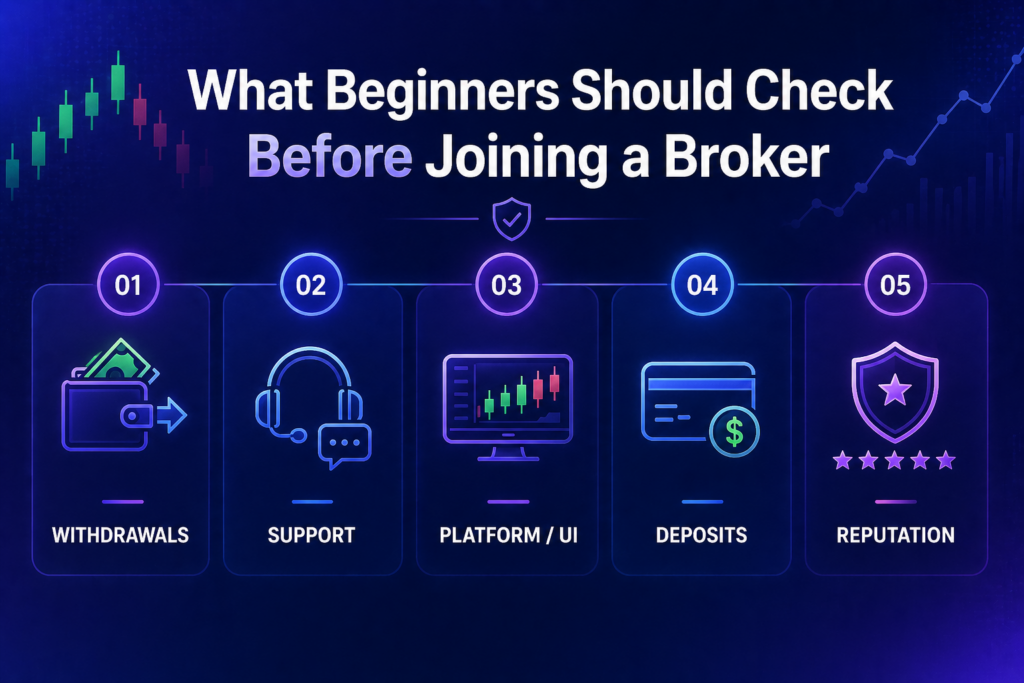
Mistake #4: Choosing the Wrong Broker
Even a good trader struggles on a poor platform.
Beginners often choose random brokers based only on bonuses or flashy ads. Instead, focus on execution quality, withdrawals, platform usability, payment methods, and reputation.
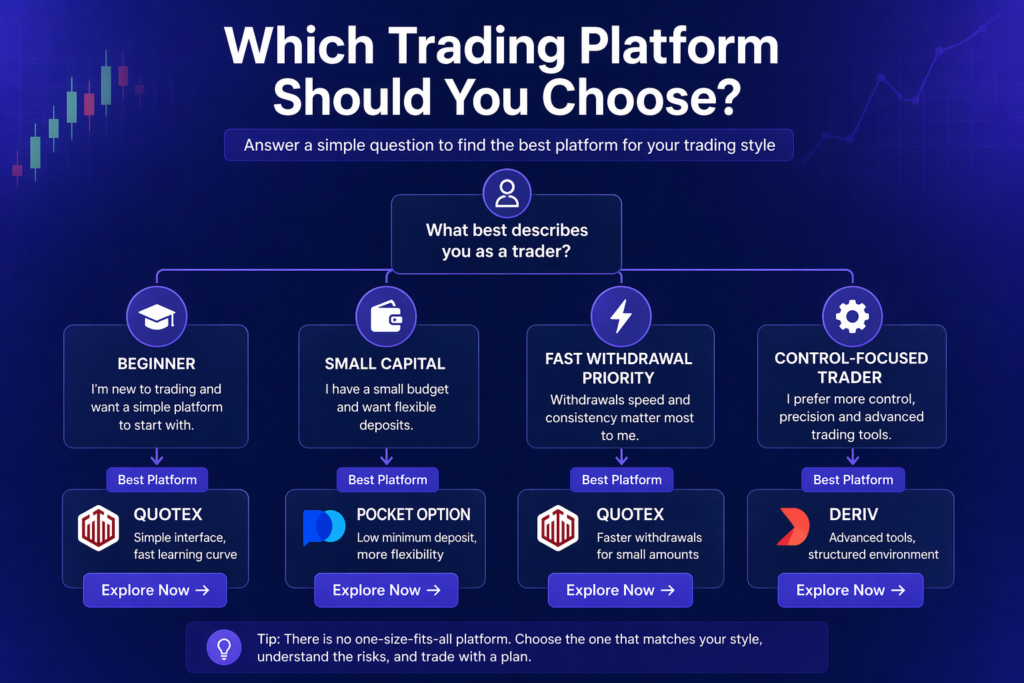
If you are comparing platforms, start with these beginner-friendly options:
Mistake #8: Chasing Signals Without Understanding Context
Copying signals from Telegram groups or social media without knowing why a trade is taken is risky.
Sometimes the signal provider uses:
Different timeframes
Different risk size
Faster execution
Hidden losses not shown publicly
Blind copying creates dependency.
Instead, learn market structure, trend direction, timing, and confirmation.
Mistake #9: Expecting Fast Riches
Many beginners enter trading expecting daily income immediately.
That mindset causes over-leverage and desperate decisions.
Trading is a skill business. Like any skill, it takes screen time, discipline, and review.
Focus on consistency first. Growth comes later.
Mistake #10: Not Reviewing Performance
If you do not track trades, mistakes repeat forever.
Keep a simple journal:
Entry reason
Timeframe used
Result
Emotion level
Lesson learned
Patterns become obvious fast.
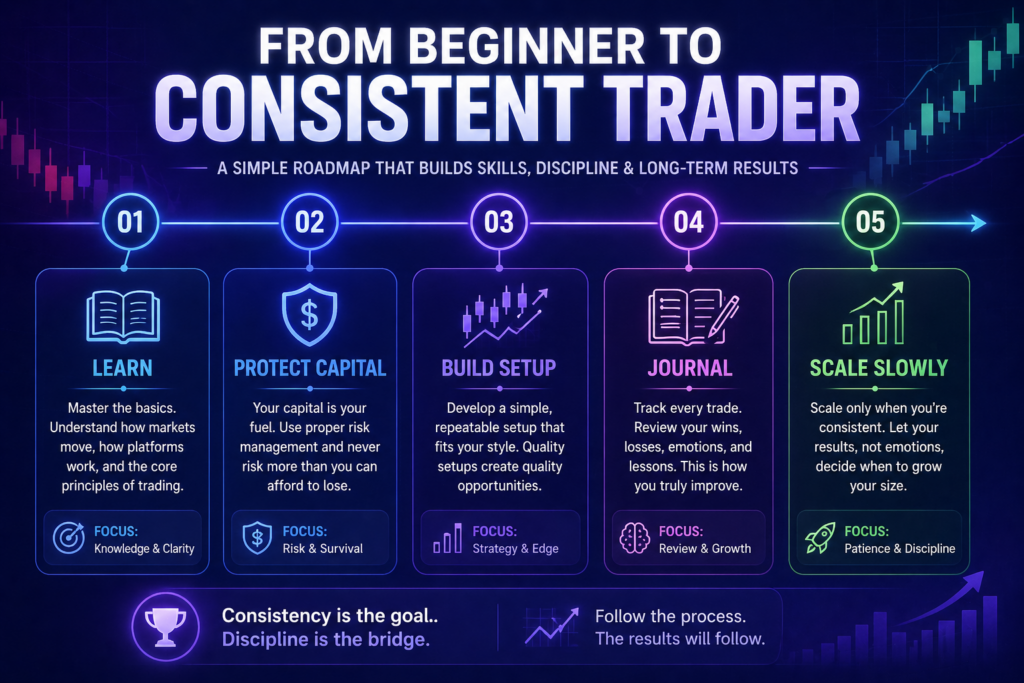
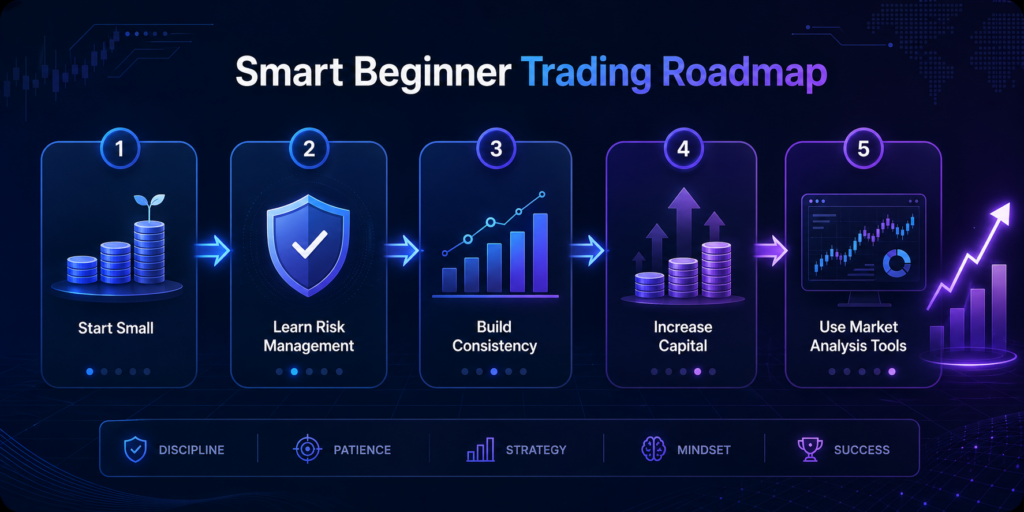
Better Beginner Path in 2026
Instead of trying to double an account quickly, use this path:
Month 1: Learn platform mechanics and risk control Month 2: Build one repeatable setup Month 3: Track stats and improve discipline Month 4+: Scale only after consistency
That approach is slower, but far more realistic.
Recommended Broker Starting Points
If you are selecting a platform, compare these based on your budget and goals:
Trading accounts rarely die from one bad trade. They die from repeated beginner mistakes.
If you control risk, stay disciplined, choose the right broker, and focus on long-term skill building, you already avoid what destroys most new traders.
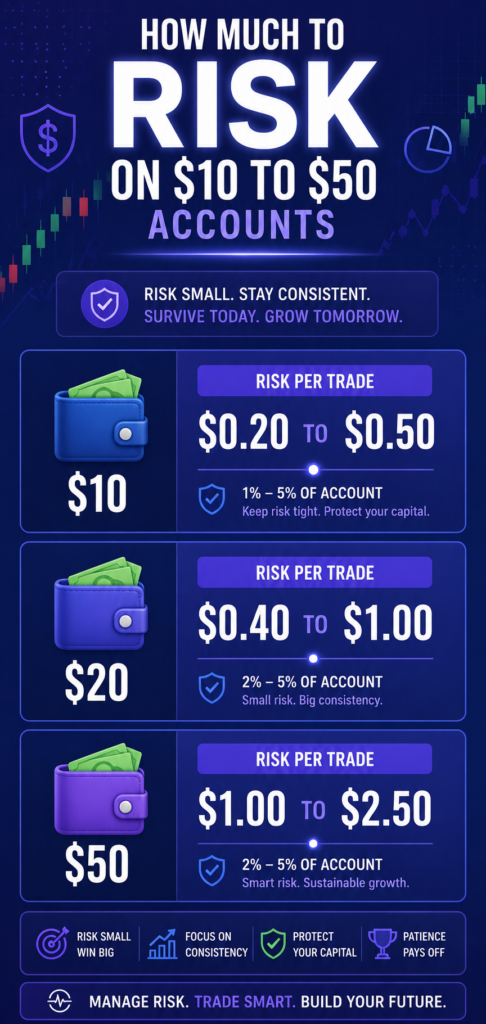
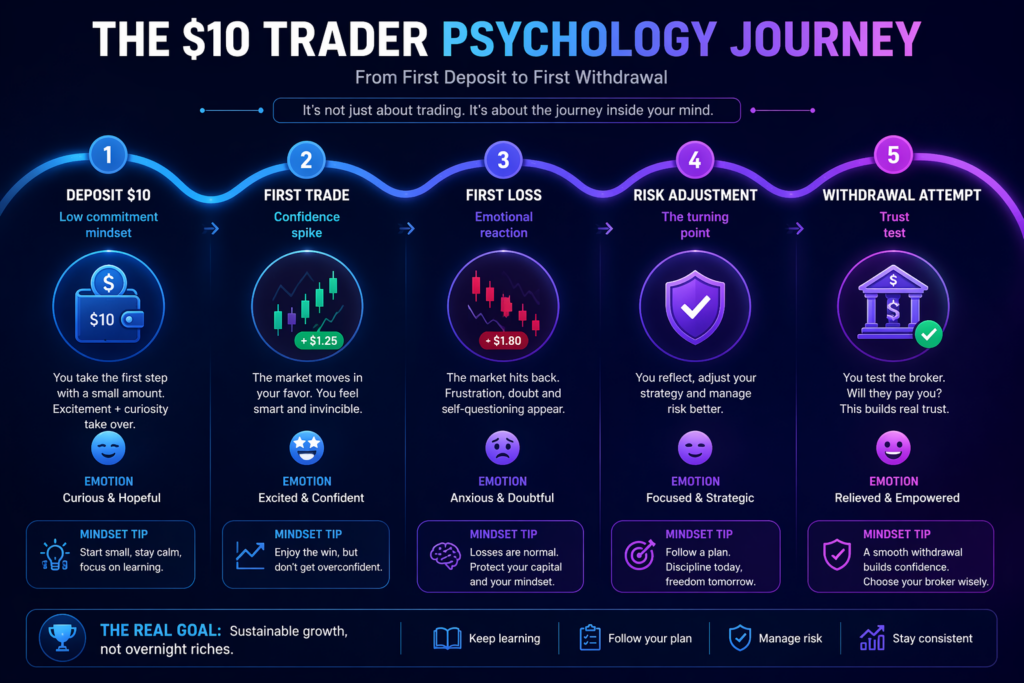
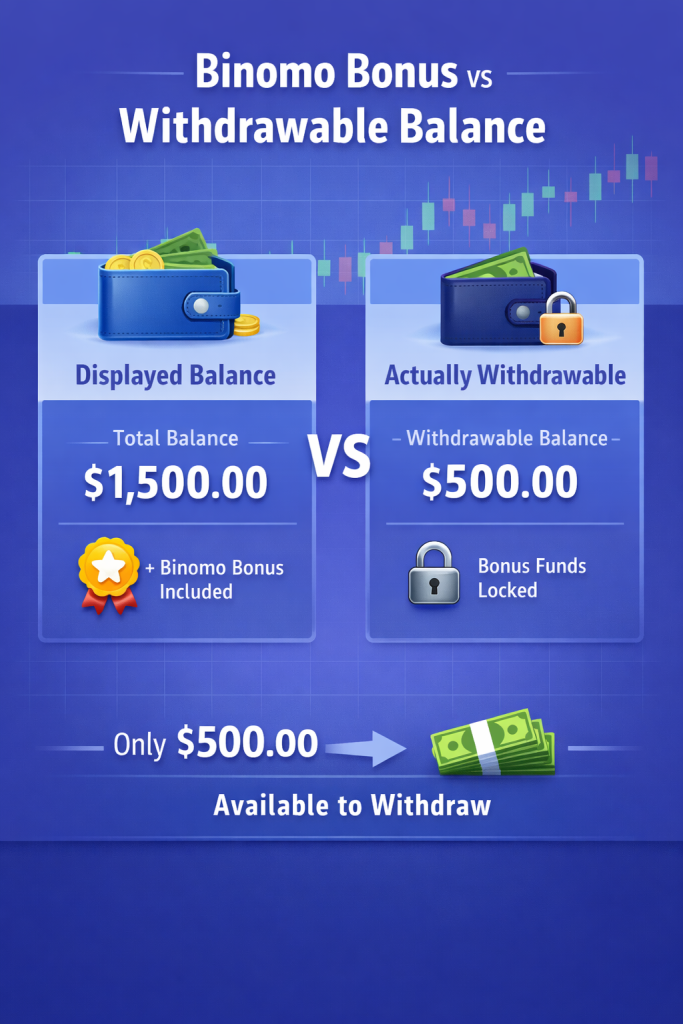
Starting with a small trading account can feel frustrating. You want fast growth, but one bad decision can wipe out weeks of progress. That is why risk management matters more for a $10 account than for a $1,000 account.
Many beginners focus only on strategy. They search for the best indicators, signals, or entry methods. But for small balances, survival comes first. If you protect your capital, you give yourself time to learn, improve, and eventually scale.
This guide explains how to manage a $10 to $50 account realistically, avoid common traps, and build habits that serious traders use every day.
Why Small Accounts Fail So Fast
Small accounts usually fail because traders try to grow too quickly. They overtrade, increase stake size emotionally, and chase losses after one bad session.
A $10 account often disappears not because the trader had no strategy, but because they risked $5 per trade and needed only two losses to collapse.
Trading all day because trade size feels small. Doubling after losses. Changing strategy every session. Ignoring withdrawal testing. Using bonus traps without understanding terms.
That is how beginners turn tiny balances into long-term opportunity.
Get an Edge With BeCoin Premium
If you want a serious advantage, join Becoin Premium and trade with deeper market insight. Get multiple timeframe analysis, stronger trade planning, structured setups, and in-depth market direction that helps remove guesswork.
Instead of random entries, trade with a smarter edge.
How Much Money Do You Really Need to Start Trading? A Realistic Beginner’s Guide for 2026
One of the most common questions beginners ask is: How much money do I need to start trading? It sounds like a simple question, but the answer depends on what you actually mean by start trading. Are you trying to learn? Are you hoping to grow savings over time? Are you trying to create a side income? Or are you chasing unrealistic social media promises of turning $20 into $2,000 overnight?
The truth is that modern online trading platforms have made entry easier than ever. Today, many brokers allow users to open accounts with a very small deposit. That means the technical barrier to entry is low. However, just because you can start with a tiny amount does not always mean it is the smartest approach.
The real question is not the minimum deposit. The real question is how much capital gives you the best chance to learn, survive mistakes, manage risk, and grow steadily.
In this guide, we’ll break down exactly how much money you really need to start trading, what beginners often misunderstand, and how to choose a starting amount that fits your goals.
Why This Question Matters More Than Most Beginners Realize
Many new traders focus entirely on profits before they understand risk. They ask how much they need to make $100 a day or replace a salary before they have placed ten disciplined trades.
This mindset creates pressure from day one. Instead of learning how markets move, how emotions affect decisions, or how risk management works, the beginner starts thinking like someone who must win immediately. That often leads to overtrading, oversized positions, emotional entries, and rapid losses.
Starting capital matters because it affects behavior. If your balance is too small, you may feel forced to take reckless risks just to see meaningful gains. If your balance is too large for your experience level, fear and stress may dominate every decision.
The best starting amount is usually the one that allows you to trade seriously without damaging your finances or emotional stability.
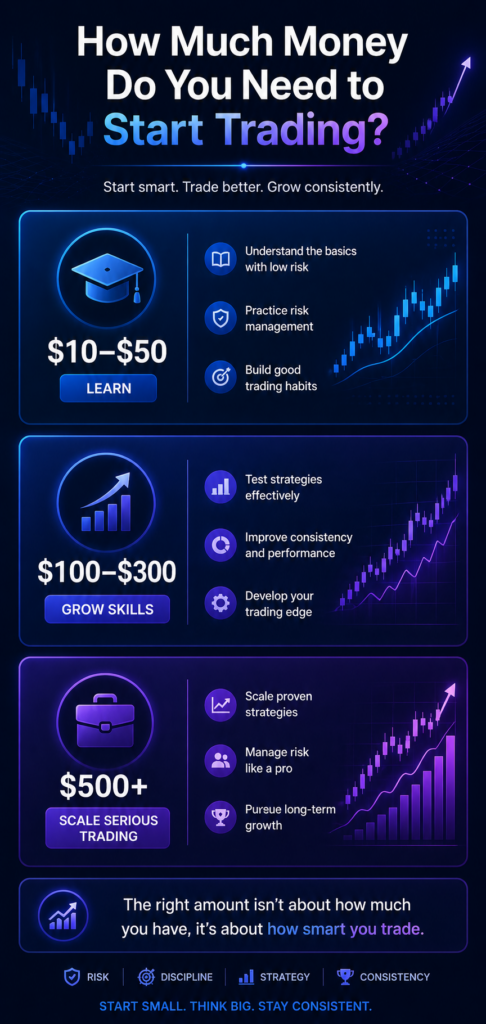
Can You Really Start Trading with $10 or $20?
Yes, in many cases you can. Several brokers now allow low minimum deposits, making it possible for beginners to open accounts with small amounts.
Platforms such as Quotex, Pocket Option, and CapitalCore are often chosen by beginners because they offer accessible entry levels and simple onboarding.
But there is an important distinction between starting and succeeding.
A $10 account may be enough to learn how the platform works, understand order placement, test emotional reactions, and experience real market movement. However, it is usually not enough to build long-term consistency or generate meaningful returns. It should be seen as a learning account, not an income account.
If you deposit $10 expecting to become profitable immediately, you are likely approaching trading the wrong way.
If You Are a Complete Beginner, Focus on Learning First
For someone brand new to trading, the most valuable goal is not profit. It is education through controlled experience.
Many beginners underestimate how different real trading feels compared to watching videos or using demo accounts. Once real money is involved, emotions appear quickly. Even small gains can trigger greed, and small losses can trigger frustration.
That is why a modest starting balance can actually be beneficial. It gives you real exposure while keeping mistakes affordable.
A beginner who starts with $20 and learns discipline may be in a better long-term position than someone who starts with $500 and loses confidence after reckless decisions.
At this stage, think of your first deposit as the cost of practical training.
How Much Money Is Ideal for Serious Beginners?
Once you understand the basics, a slightly larger balance often makes more sense. For many new traders, the range of $100 to $300 is more practical than ultra-small deposits.
Why? Because this balance gives you room to manage trades more rationally. You are less likely to feel that every trade must be a huge winner. You can spread risk more sensibly, think longer term, and focus on process rather than desperation.
With a $100 balance, even small improvements in consistency become visible. With a $10 balance, many people feel forced to take unnecessary risks because small percentage gains look insignificant in dollar terms.
This is one reason why tiny accounts can sometimes teach bad habits. They encourage gambling behavior when what you need is structured discipline.
What If You Want to Make Real Monthly Income?
This is where expectations need to be realistic.
Many people ask how much they need to earn serious money from trading. The honest answer is that meaningful income usually requires three things working together:
Sufficient capital
Proven skill
Strong consistency
Without skill, more money only increases the size of mistakes. Without capital, even good returns may not produce meaningful cash flow.
For example, if someone averages a 5% monthly return:
On $100, that is $5
On $1,000, that is $50
On $5,000, that is $250
On $10,000, that is $500
This illustrates why many beginners misunderstand the path. They focus only on percentage returns and ignore account size.
Even strong traders often grow accounts gradually rather than expecting instant full-time income.
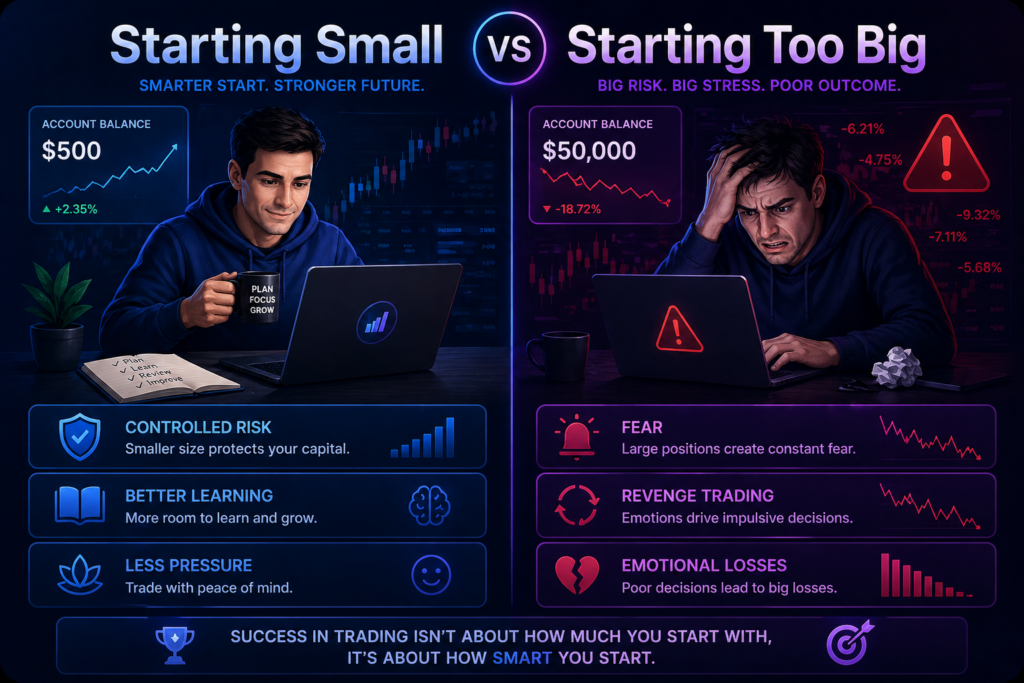
The Dangerous Mistake of Starting Too Big
Some beginners believe depositing a large amount automatically improves their chances. In reality, it often magnifies problems.
Imagine someone with no experience depositing $2,000 because they want quick results. Every small fluctuation now feels emotionally intense. Losses feel painful. Wins feel addictive. Decisions become harder, not easier.
Large early deposits often create stress-driven trading, fear of losses, impatience, revenge trading after setbacks, and overconfidence after lucky wins.
A smaller account gives you room to make beginner mistakes without major financial damage.
In many cases, traders lose less money overall by starting small and increasing capital later.
How Much Can You Afford to Lose?
This question matters more than how much you can deposit.
Never trade with money needed for rent, bills, food, emergencies, or debt obligations.Trading capital should be risk capital. That means money you can lose without harming your life.
When someone trades with “must not lose” money, emotions become extreme. Every trade carries personal pressure. That pressure usually leads to poor decisions.
If losing the deposit would cause panic, the amount is probably too high.
The healthiest trading capital is money allocated specifically for learning and growth, not survival.
Choosing a Safe Platform Matters Too
Even the perfect starting balance means little if you choose the wrong broker. Security, withdrawal reliability, account verification policies, and platform reputation all matter.
If you are brand new, starting with a small balance can make sense. Use it to understand execution, timing, emotions, and discipline. This phase is about learning how not to lose foolishly.
The Skill Builder Plan
If you already understand basics and have practiced seriously, a medium starting balance may be better. It allows more realistic risk management and better habit development.
The Growth Plan
If you already have tested methods, emotional discipline, and patience, larger capital may help scale results. But only increase size after consistency, not before.
Which Broker Should You Consider as a Beginner?
Many beginners look for low barriers, easy interfaces, and accessible funding options.
Quotex
Often preferred for its simple layout and beginner-friendly experience.
Online trading content often promotes dramatic screenshots, fast profits, and overnight transformations. What it rarely shows is the reality of months spent learning discipline, taking losses, refining systems, and improving mindset.
Most successful traders are not winning because they started with huge money. They are winning because they built repeatable habits.
Capital helps, but character matters more.
Patience matters more.
Risk control matters more.
Without those qualities, even a large account can disappear quickly.
Want Better Entries and Smarter Market Decisions?
Many beginners lose because they trade without context. They enter random setups, follow noise, or react emotionally to short-term moves.
If you want a stronger edge, structured analysis matters.
Join BeCoin Premium
Get in-depth market analysis across multiple timeframes and thousands of assets including crypto, forex, stocks, indices, and commodities.
You’ll gain access to clearer market structure, stronger trade ideas, and deeper insight before entering positions.
You do not need thousands of dollars to begin. You need enough money to learn seriously, manage risk properly, and stay emotionally stable.
For many beginners:
$10 to $50 can be enough to experience real trading and learn fundamentals. $100 to $300 is often more practical for developing consistency. Larger balances make sense only after skill is proven.
The smartest path is not to start big. It is to start wisely.
Trading success is usually built through discipline, education, and gradual growth—not one large deposit.
Frequently Asked Questions
Can I start trading with only $10?
Yes, many platforms allow it. But use that amount as a learning tool rather than expecting serious income.
Is $100 enough to trade seriously?
For many beginners, yes. It can provide a more realistic experience than ultra-small balances.
Should I borrow money to trade?
No. Borrowed money adds pressure and often leads to bad decisions.
Is more money always better?
Only if you already have skill. Without discipline, larger balances simply create larger losses.
Most Traders Don’t Lose Because of Strategy — They Lose Because of Behavior
If you ask most beginners why traders fail, you’ll hear answers like:
“Bad strategy”
“Wrong indicator”
“Market manipulation”
“Need better signals”
But after observing thousands of beginner trading behaviors, the truth is much simpler and more uncomfortable:
“Most traders lose money because of how they behave, not what they use.”
Even profitable strategies fail in the hands of emotional, impatient, and unprepared traders.
The market does not punish beginners for being new, it punishes them for being undisciplined.
Why 90% of Traders Lose Money (The Real Breakdown)
There is no single reason. It is a chain reaction of mistakes that starts before the first trade.
Let’s break it down properly.
1. They Enter Trading With a “Fast Money” Mindset
Most beginners do not enter trading thinking about skill development. They enter thinking:
“How fast can I double this?”
“Can I turn $50 into $500?”
“How quickly can I withdraw profit?”
This mindset immediately creates pressure.
Instead of waiting for good setups, they start forcing trades.
When trades are forced, logic disappears. And when logic disappears, losses become predictable.
Successful traders do not start with speed. They start with survival.
Check out our guide on KYC verification so you don’t find any issues in withdrawals.
2. They Risk Too Much on Every Trade
This is one of the most destructive habits in trading.
A beginner with a small account often thinks:
“If I risk more, I can grow faster.”
So instead of risking 1–3%, they risk 10%, 20%, or even more per trade.
At first, it feels exciting. One win feels powerful. But the problem shows up immediately after a few losses.
A short losing streak doesn’t just hurt — it destroys the entire account psychologically and financially.
Once emotion enters, recovery trading begins, and that usually finishes the account completely.
Professional traders survive because they treat risk like a rule, not a choice.
3. They Trade Emotionally Instead of Logically
Emotional trading is the silent account killer.
It usually starts after one bad trade:
“I need to recover this loss”
“That trade was unlucky”
“One more trade to fix it”
This is where discipline breaks.
A trader who was calm suddenly becomes reactive. And reactive decisions are almost always wrong in trading environments.
In most cases, traders don’t lose in one bad trade — they lose in the emotional recovery phase after it.
4. They Have No Real Trading Plan
Most beginners believe watching signals or indicators is a “plan.”
It is not.
A real trading plan answers:
When to trade
When NOT to trade
How much to risk
How many trades per day
When to stop
Without these rules, every decision becomes random.
And randomness in trading usually leads to inconsistency — and inconsistency leads to losses.
Even a simple rule-based system beats emotional guessing.
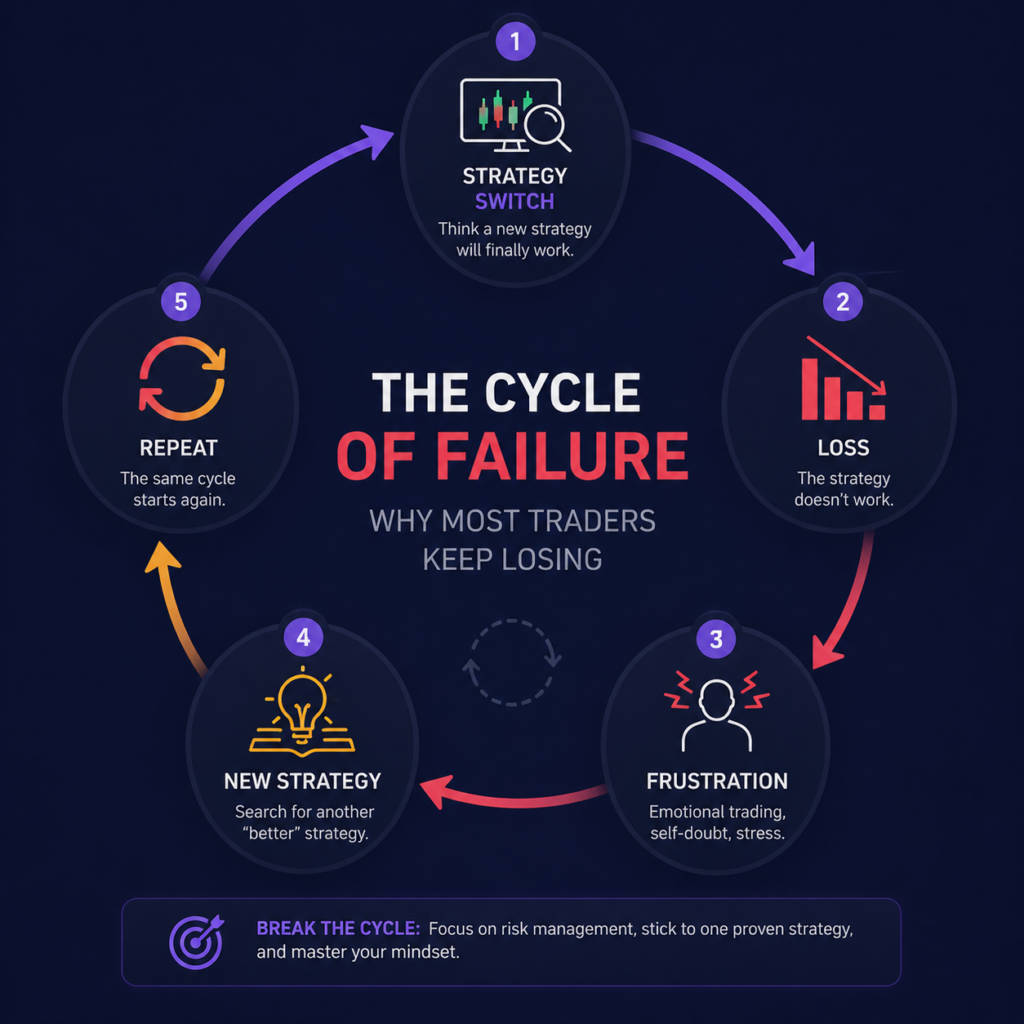
5. They Switch Strategies Too Often
A very common beginner cycle looks like this:
Week 1: RSI strategy Week 2: Moving average crossover Week 3: Signals group Week 4: New “winning system” on YouTube
Nothing is given enough time to be tested properly.
So instead of improving one system, they keep restarting from zero.
Professional traders don’t chase new methods constantly. They refine one approach and master it through repetition.
6. They Ignore Risk Control Because They Focus on Profits
Beginners usually obsess over:
Winning trades
Profit percentage
Fast growth
But ignore:
Maximum loss per day
Drawdown control
Capital protection
Here is the reality:
Profit is a result. Risk control is the system.
Without risk control, even a good winning streak cannot save the account long-term.
This is where most traders fail silently — not in losing trades, but in uncontrolled losing streaks.
7. They Don’t Understand Platform Behavior
This is often overlooked but important.
Some traders lose not because of strategy alone, but because:
They start live trading too early
They don’t understand execution timing
They don’t test withdrawals
They choose overly complex interfaces
They get distracted by bonuses or features
A confusing environment creates confusion in decisions.
That is why simplicity matters in the beginning — not complexity.
Why Small Accounts Fail Faster
Small accounts fail quickly for one main reason:
Pressure.
When capital is small, traders feel forced to grow it fast.
Instead of building consistency, they chase multiplication.
This leads to:
Oversized trades
Revenge trading
Overtrading
Emotional breakdown after losses
Ironically, small accounts don’t fail because they are small — they fail because traders treat them like lottery tickets.
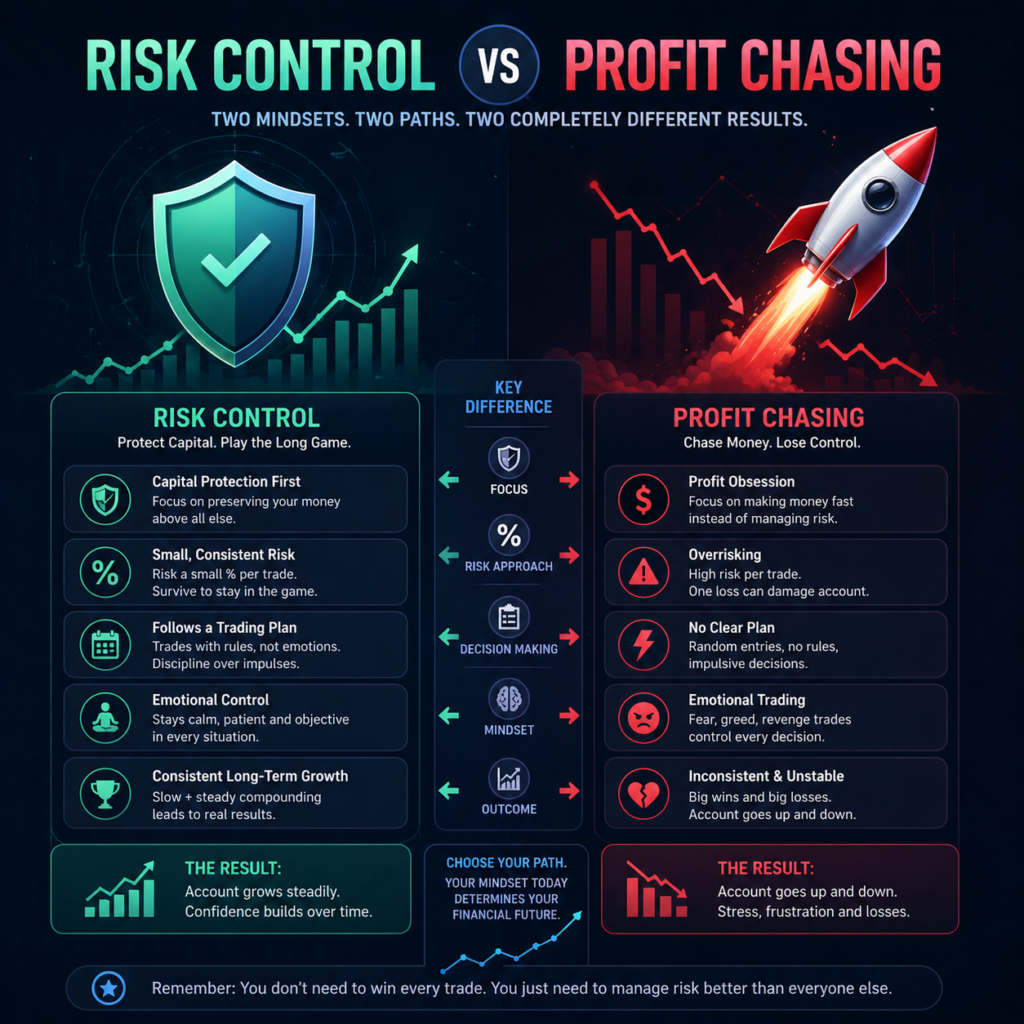
What Actually Separates Winners From Losers
Successful traders are not smarter.
They are not lucky.
They simply behave differently.
Losing Traders:
Trade emotionally
Focus on profit first
Overrisk
Switch systems often
React to losses
Winning Traders:
Focus on survival first
Use fixed risk rules
Stay consistent
Follow structured plans
Accept losses as part of the process
The difference is not technical. It is behavioral.
A Simple Beginner Framework That Actually Works
If you are new, ignore complexity.
Start with this structure:
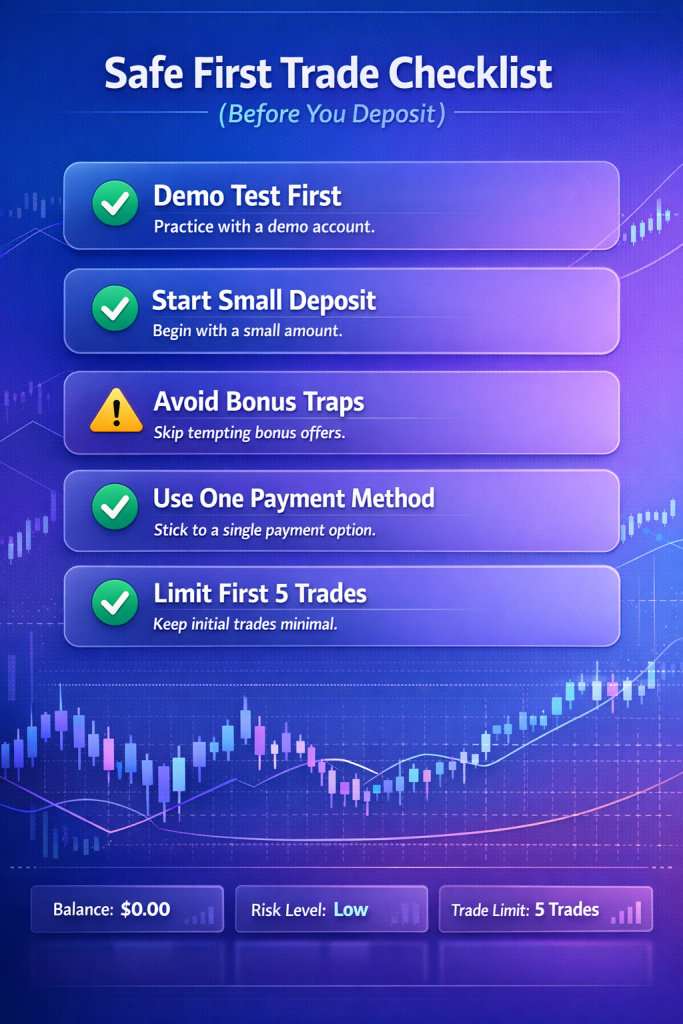
Step 1: Demo First
Understand execution, timing, and platform behavior.
Step 2: Start Small
Risk minimal capital to remove emotional pressure.
Step 3: Use Fixed Risk
Never increase trade size emotionally.
Step 4: Limit Daily Trades
Fewer trades = better decisions.
Step 5: Review Mistakes Weekly
Focus on patterns, not individual trades.
This alone puts you ahead of most beginners.
Mid-Page Insight
Before choosing any trading approach or platform, it’s important to understand how execution, psychology, and risk exposure actually shape outcomes.
That’s why I developed the Becoin trading framework, a structured system designed to help traders make disciplined decisions instead of emotional ones.
If You Still Want to Trade, Understand This First
The platform you use will not make you profitable.
But it can either support discipline or destroy it.
Beginners should prioritize:
Simple execution
Clear interface
Demo availability
Low deposit entry
Stable withdrawal behavior
Many users compare platforms like Quotex, Pocket Option, or Deriv depending on simplicity and goals but the real focus should always be discipline first, platform second.
Final Truth: Trading Fails Are Predictable
The reason 90% of traders lose is not a mystery.
It is repetition:
Same emotional mistakes
Same risk behavior
Same impatience
Same lack of structure
If you fix behavior, results naturally improve.
If you don’t, no strategy will save you.
Join Becoin Premium for deeper broker analysis, risk systems, and real testing insights designed for safer trading decisions.
FAQ
Why do most traders lose money?
Because they overrisk, trade emotionally, and lack discipline and structure.
Is trading actually profitable for beginners?
Yes, but only after developing risk control and consistent behavior.
What is the biggest mistake beginners make?
Trying to grow money too fast.
Can strategy alone make me profitable?
No. Psychology and risk control matter more than strategy.
How do I stop losing money in trading?
Reduce risk, stop emotional trading, and follow a structured plan.
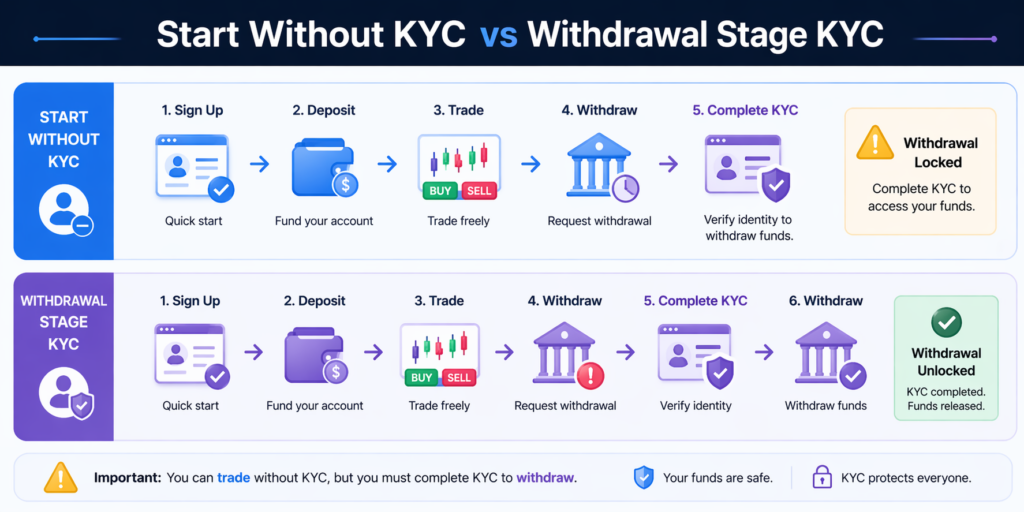
Best Broker Without KYC (2026) — Truth + Risks Before You Choose
If you’re searching for the best broker without KYC, you likely want speed, low friction, and fast access to trading.
But here’s the reality:
Most traders don’t lose because of strategy. They lose because they choose the wrong platform early.
No-KYC brokers can help you start quickly — but they also introduce hidden risks around withdrawals, verification, and account limits.
This page is built to help you decide fast and correctly.
The Truth About No-KYC Brokers
“No KYC” usually means no KYC at deposit stage
Most platforms still require verification before or during withdrawal
Problems usually appear when:
You try to withdraw profit
You switch payment methods
You scale account size
For users starting with small capital, understanding capital protection is critical — it’s explained in this beginner-friendly broker selection guide on your site.
And if you’re focused on starting with minimal risk, the behavior of small deposits and platform limits is covered in your tested $10 deposit broker breakdown.
👉 The key takeaway: Skipping KYC early does not remove risk — it simply delays it.
1. Quotex — Best for Beginners and Fast Execution
Why it fits: Simple, fast, and low barrier to entry. Ideal if you want to start immediately without complexity.
Strengths:
Low minimum deposit
Clean interface for beginners
Fast execution environment
Crypto withdrawals generally smoother
Risk Note:
Verification is often required when withdrawing larger amounts.
Best Use Strategy:
Start small → test trades → test withdrawal early
Start with a small deposit and immediately test execution and withdrawal behavior on Quotex before scaling.
2. Pocket Option — Best for Features and Flexibility
Why it fits: More tools, more payment options, and flexible trading features.
Use Olymp Trade for guided entry, but verify your account early and test withdrawal before increasing deposit.
Quick Comparison Table (Decision Snapshot)
Platform
Best For
Entry Level
Withdrawal Behavior
Risk Level
Quotex
Beginners, fast execution
Low
Smooth (small size)
Medium
Pocket Option
Features, flexibility
Low
Bonus dependent
Medium
Deriv
Control, long-term use
Medium
Structured
Low-Medium
Olymp Trade
Guided beginners
Low
Moderate
Medium
Important Mid-Page Insight
Before choosing any platform, it’s important to understand how execution and risk exposure actually affect results. That’s why I created the Becoin trading framework for structured decision-making.
If you’re still unsure, your fastest path is to combine this with your complete beginner broker decision guide and make a structured choice instead of guessing.
This is built for traders who want controlled growth, not random outcomes.
Safest Trading Platforms (Risk Breakdown) – Real Comparison for 2026
Choosing a trading platform isn’t about features — it’s about avoiding hidden risk.
Most traders compare brokers like Quotex vs Pocket Option vs Deriv vs Olymp Trade expecting a clear winner. Instead, they find conflicting reviews, promotional claims, and no real explanation of how these platforms behave when money is on the line.
The real risks don’t show up on landing pages:
Withdrawal friction
Execution inconsistencies
Bonus restrictions
Verification timing
This guide breaks down those exact factors so you can make a decision based on behavior, not marketing.
Platforms Compared
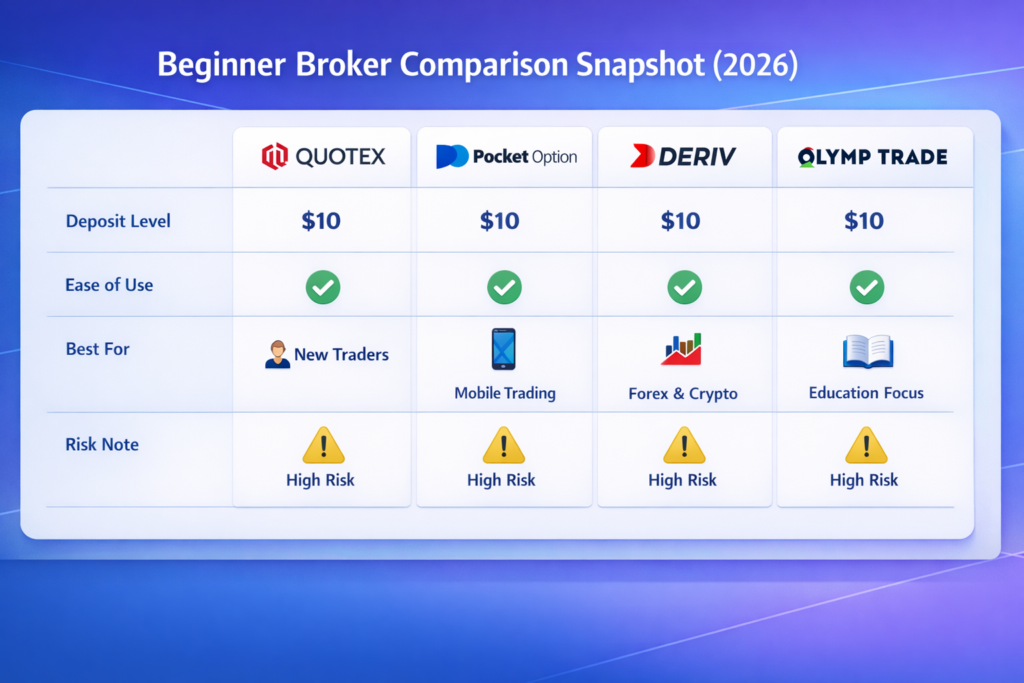
Quotex Pocket Option Deriv Olymp Trade
Deposits & Minimum Capital
Platform
Minimum Deposit
Payment Flexibility
Risk Insight
Quotex
$10
High
Encourages quick entry, but also impulsive trading
Pocket Option
$10
Very High
Easy funding, often leads to overtrading
Deriv
$5–$10
Moderate
Lower entry, but setup is more technical
Olymp Trade
$10
Moderate
More structured onboarding
Analysis
Low deposit brokers feel “safe,” but they often create behavioral risk.
Traders with $10 accounts typically:
Trade too frequently
Ignore position sizing
Focus on speed instead of strategy
This is why many losses are not platform-related — they’re behavior-driven.
👉 For beginners looking to start simple, you can explore Quotex here.
👉 If you want more deposit flexibility and asset variety, Pocket Option is available here.
Withdrawals & Processing Behavior
Platform
Speed (Typical)
Consistency
Friction Level
Risk Insight
Quotex
Fast (hours–1 day)
High
Low
Strong for small withdrawals
Pocket Option
Medium (1–3 days)
Moderate
Medium
Delays increase with size
Deriv
Medium
High
Low
Stable but method-dependent
Olymp Trade
Medium–Slow
Moderate
Medium
More verification layers
Analysis
Withdrawals reveal true broker reliability.
Common patterns:
Fast small withdrawals build trust
Larger withdrawals trigger checks
Inconsistent timing = biggest red flag
👉 Based on withdrawal consistency, Quotex performs better for smaller accounts — you can test it here.
👉 For users who prefer a more structured system with stable processing, Deriv is available here.
Trading Experience & Execution Quality
Platform
Execution Type
Interface Simplicity
Stability
Risk Insight
Quotex
Smooth
Very Simple
High
Easy but less transparent
Pocket Option
Slight delays
Moderate
Medium
Execution variance exists
Deriv
Technical
Complex
High
Better precision
Olymp Trade
Structured
Simple
Medium
Slower but controlled
Analysis
Execution is where many traders silently lose money.
Issues include:
Entry delay in volatility
Price mismatch
Chart vs execution difference
Simpler platforms reduce friction but often hide execution mechanics.
👉 If you prefer simplicity and fast decision-making, start with Quotex.
👉 If you want more control and precision, Deriv is a better fit.
Bonuses (Hidden Risk Layer)
Platform
Bonus Availability
Conditions Complexity
Risk Level
Quotex
Limited
Low
Safer
Pocket Option
Frequent
High
Risky
Deriv
Rare
Low
Safe
Olymp Trade
Occasional
Medium
Moderate
Analysis
Bonuses are often misunderstood.
They introduce:
Locked funds
Trade volume requirements
Withdrawal restrictions
👉 Pocket Option offers aggressive bonuses, but only suitable if you understand conditions
👉 If you want fewer restrictions, Deriv avoids most bonus-related complications.
Verification (KYC) & Restrictions
Platform
KYC Strictness
When Triggered
Risk Insight
Quotex
Medium
On withdrawal
Can delay payouts if unprepared
Pocket Option
Medium–High
Early
Slower onboarding
Deriv
High
Early
More predictable
Olymp Trade
High
Early
Safer but slower
Analysis
The biggest mistake traders make is ignoring KYC until withdrawal.
👉 Platforms like Deriv and Olymp Trade reduce surprises by verifying early.
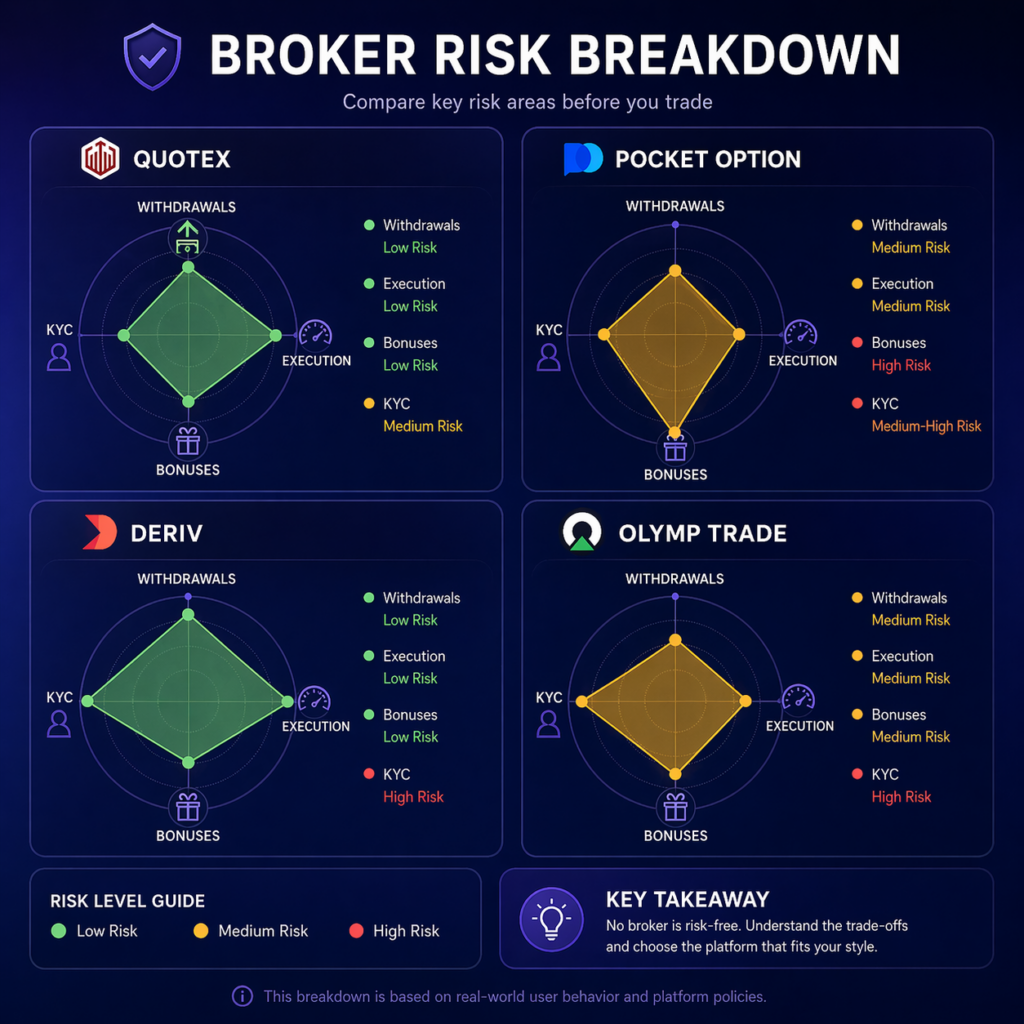
Risk Factors (What Actually Matters)
Platform
Main Risk
Quotex
Over-simplified trading behavior
Pocket Option
Bonus-related withdrawal friction
Deriv
Complexity for beginners
Olymp Trade
Slower systems
No platform is risk-free.
The real edge comes from understanding:
When platforms slow down
How execution behaves
What triggers restrictions
Choosing a broker is only step one — the real edge comes from understanding how platforms behave under pressure, how execution affects outcomes, and how to control risk with small capital.
That’s exactly what the Becoin trading system breaks down in depth — helping you make smarter trading decisions, not just broker choices.
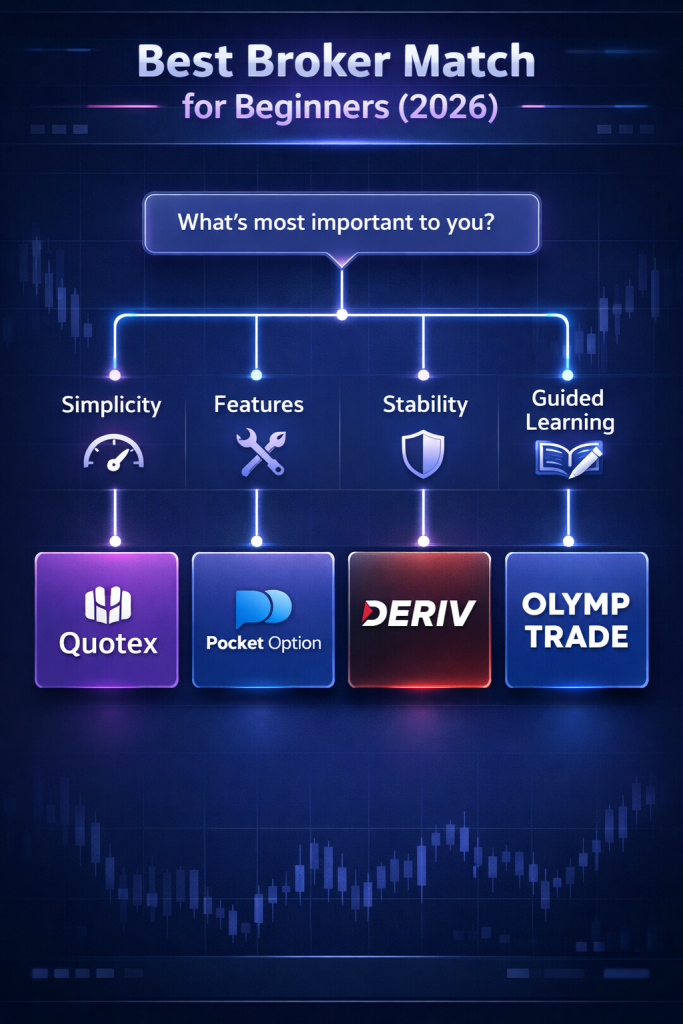
Best Choice Based on User Type
Beginner Traders
Best Fit: Quotex Simple interface, fast learning curve
Choose Quotex → if you want speed + simplicity Choose Pocket Option → if you want flexibility but understand bonus risk Choose Deriv → if you want control and structured trading Choose Olymp Trade → if you prefer stricter systems
FAQ
Which broker is better for beginners in 2026?
Quotex is easier to start with due to its simple interface, but beginners must still manage risk carefully.
Fastest withdrawal broker comparison – which wins?
Quotex generally performs fastest for small withdrawals, while others may slow down depending on volume and verification.
Is Deriv safer than Quotex?
Deriv offers more structured systems and transparency, but requires more experience.
Can brokers delay withdrawals?
Yes — especially due to KYC issues, bonus conditions, or unusual trading behavior.
Final Thoughts
This comparison is based on real platform behavior — not promotional claims.
If you want deeper analysis of execution patterns, withdrawal triggers, and proven decision frameworks, Becoin Premium gives you the kind of insight that actually helps you make confident trading decisions, not guesses.
Fastest Withdrawal Brokers (Real Test Results)
The first time I made a profitable trade, I wasn’t thinking about strategy anymore. I was thinking about one thing.
Can I actually withdraw this?
I requested my payout and waited. And waited. That “processing” label stayed there longer than my trade itself. That moment changed how I evaluate brokers.
Since then, I’ve made it a rule. I don’t trust any platform until I test withdrawals myself.
So I funded multiple accounts, traded small, and withdrew repeatedly to identify the fastest withdrawal brokers based on real experience, not claims.
This is exactly what happened.
Start with brokers that already proved fast payouts in my tests. Open your account and run a small withdrawal within your first 24 hours.
Why Withdrawal Speed Became My Priority
Most traders focus on entries and signals. I used to do the same. But over time, I realized something uncomfortable.
A winning trade means nothing if your money is stuck.
What I noticed across top-ranking content was a gap. Everyone says fast withdrawals, but almost no one shows real timing, second withdrawal behavior, or what happens after you start making profits.
That’s exactly what I tested.
My Real Testing Setup
I kept things simple and realistic.
I deposited between $10 and $50, placed a few trades, and then requested withdrawals quickly.
Each broker was tested on:
First withdrawal speed
Second withdrawal consistency
Payment method performance
Any hidden delays
This helped me avoid the common trap where brokers process one withdrawal fast, then slow things down later.
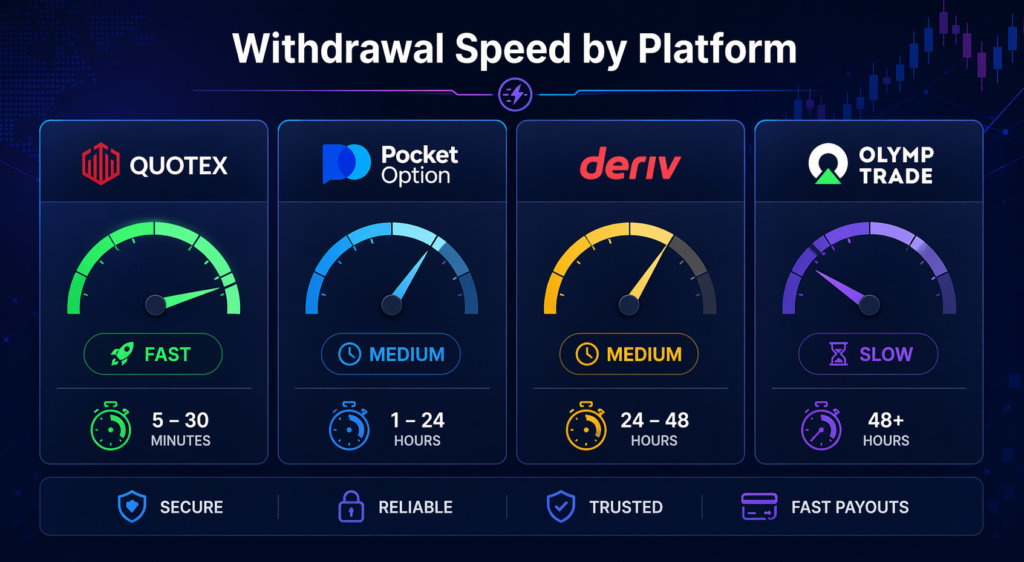
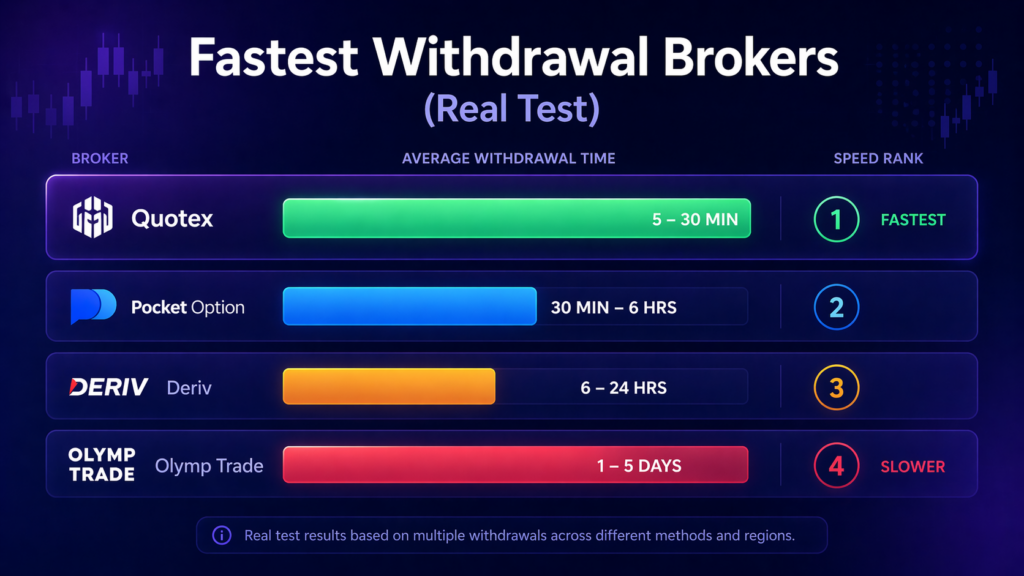
Fastest Withdrawal Brokers (My Real Results)
Here’s what actually happened when I withdrew funds:
Broker
Method Used
First Withdrawal
Second Withdrawal
My Verdict
Quotex
USDT
8–10 minutes
10–15 minutes
Extremely consistent
Pocket Option
Bitcoin
20–30 minutes
30–45 minutes
Reliable
Deriv
Skrill
1–2 hours
2–3 hours
Stable
Olymp Trade
Bank/Card
6–12 hours
12–24 hours
Slower
Quotex – Fastest in My Real Testing
My first withdrawal on Quotex didn’t feel real. I requested a USDT payout and checked my wallet expecting a delay.
The funds were already there.
The second withdrawal confirmed it wasn’t luck. It stayed under 15 minutes, which made it the most consistent among all the fastest withdrawal brokers I tested.
What stood out was how quickly requests moved from processing to completed. There was almost no friction.
If you want the fastest payout experience I’ve tested, start with Quotex and try a small USDT withdrawal yourself to see the speed in real time.
Pocket Option – Reliable with Slight Delay
Pocket Option performed well, but not perfectly consistent.
My Bitcoin withdrawal took around 25 minutes the first time and slightly longer the second time. Still fast enough to trust.
There were no verification issues or unnecessary delays, which made the experience smooth overall.
It didn’t beat Quotex on speed, but it stayed reliable.
Open a Pocket Option account and test a small Bitcoin withdrawal. It’s a solid choice if you want reliability with decent speed.
My first withdrawal took several hours, and the second took even longer. Nothing broke, but the speed difference compared to other brokers was obvious.
This is the kind of delay that becomes frustrating over time, especially if you’re actively trading.
If you still want to try Olymp Trade, start small and test your withdrawal early so you know exactly what to expect.
What Actually Happens When You Withdraw
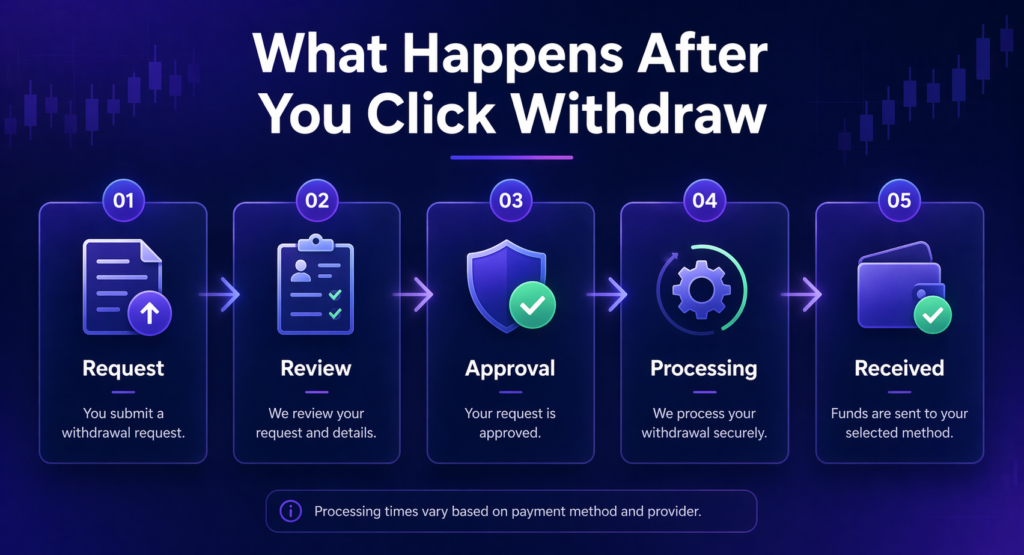
I used to think withdrawals were instant after clicking the button. That’s not how it works.
There are multiple hidden steps behind the scenes:
Internal review
Approval
Processing
Payment network delay
The fastest withdrawal brokers minimize the first two steps. That’s why some platforms feel instant while others don’t.
The Biggest Mistake I Made Early
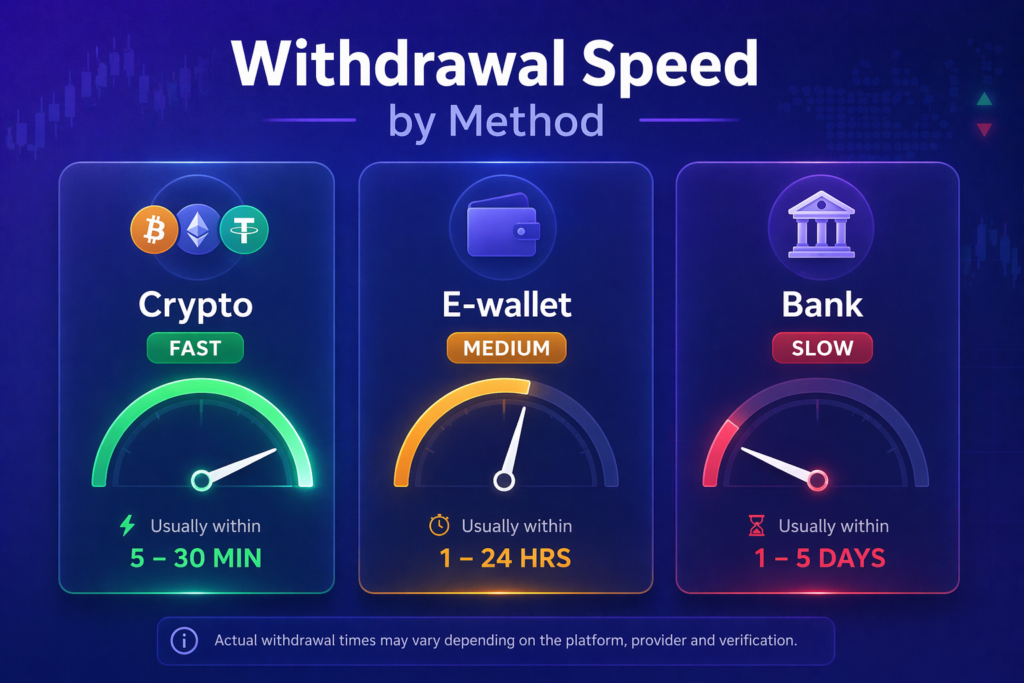
I was using bank cards for withdrawals.
That alone added hours and sometimes days to my payouts.
Once I switched to crypto, everything changed.
Here’s what I observed:
Crypto: 5 to 45 minutes
E-wallets: 1 to 3 hours
Bank methods: 6 to 48 hours
If speed matters, your payment method matters just as much as your broker.
If you’re just starting, I’ve explained how to set this up properly here.
What Changed After I Started Making Profits
This is something I didn’t expect.
After a few profitable sessions, one broker slightly slowed down my withdrawal.
Not enough to panic, but enough to notice.
So I adjusted my approach. I stopped withdrawing everything at once and started spacing requests. That kept things smooth.
This kind of detail is missing from most reviews, but it makes a real difference.
How I Now Test Any Broker
Before trusting any platform, I follow a simple process.
Deposit small. Trade a bit. Withdraw early. Repeat once.
Open an account with one of the tested brokers above and run your own withdrawal test today. This single step will save you from choosing the wrong platform.
Real vs Claimed Withdrawal Speed
Here’s what I noticed when comparing claims vs reality:
Claim
Reality
Instant withdrawals
Mostly true for crypto only
Same speed for everyone
Depends on behavior and method
Top broker means fastest payout
Not always
One fast withdrawal is enough
Needs repeat testing
This gap is why most traders get surprised later.
Final Thoughts on Fastest Withdrawal Brokers
After testing multiple platforms, one thing became clear.
The fastest withdrawal brokers are the ones that stay consistent, not just fast once.
For me, Quotex and Pocket Option stood out based on real usage.
But the bigger takeaway is simple.
You should never trust a broker fully until you test withdrawing from it yourself.
If you want my exact broker setup, real trade breakdowns, and withdrawal-tested strategies, join Becoin Premium. You’ll see what actually works before risking more money.
Top 3 Trading Platforms That Actually Pay (Proof-Based)
Choosing the wrong broker at the start is where most traders fail.
Not because they lack strategy but because they end up stuck with slow withdrawals, poor execution, or confusing platforms that break decision flow.
If your goal is to find the best trading platform for small deposit or the best broker for beginners, you don’t need endless comparisons.
You need a short list of platforms that:
Have been practically tested
Show consistent payout behavior
Allow you to start small and scale safely
This page is built to help you make that decision fast and confidently.
Top Platforms That Actually Pay (2026)
Quotex — Best Choice for Beginners & Small Deposits
Quotex stands out because it removes friction. The interface is clean, execution is straightforward, and you can start without overthinking every step.
For beginners, this matters more than advanced tools. You need a platform that lets you focus on understanding trades, not fighting the interface.
Withdrawal behavior is one of the strongest points here. Based on repeated testing patterns, Quotex processes payouts consistently under normal usage conditions. That alone makes it a strong candidate for anyone searching for the best binary options platform 2026.
There is a limitation. During high volatility, execution timing can slightly vary. This isn’t unique to Quotex, but it’s something you should be aware of early.
For users starting with small capital, understanding how to protect that capital is critical. That’s why basic capital safety concepts are covered in beginner risk management guides — because platform choice alone isn’t enough.
👉 Start with Quotex using a small deposit. Test 2–3 trades, then request a withdrawal. Don’t scale until you see the process yourself.
Pocket Option — Best for Flexibility & Feature Control
Pocket Option is the next step if you want more control over your trading environment.
It offers more indicators, more customization, and even social trading features. This makes it attractive for users who feel limited by simpler platforms and want to experiment with different setups.
In terms of payouts, Pocket Option has shown stable withdrawal behavior when used consistently and without bonus complications. The key difference here is flexibility — not simplicity.
That flexibility comes with a trade-off. The interface can feel slightly overwhelming if you’re completely new. This is why many beginners start simple first, then transition.
Understanding how different platforms handle payouts becomes important here. Differences in withdrawal timing and behavior are explained in platform payout analysis breakdowns — and they directly affect user experience.
👉 Use Pocket Option if you want more control. Start on demo, then switch to a small real deposit once you understand the interface.
Deriv — Best for Stability & Long-Term Use
Deriv is built differently. It’s not focused on hype or simplicity — it’s focused on structure and consistency.
This platform has been around longer than most and offers multiple trading environments, including synthetic indices. That gives it a different kind of appeal: stability over speed.
Withdrawal reliability is one of its strongest aspects. For users thinking long-term, this matters more than flashy features.
The downside is the learning curve. It takes slightly more effort to understand compared to beginner-first platforms like Quotex.
If your goal is not just quick trades but building a controlled system, Deriv becomes a logical choice.
👉 Choose Deriv if you want a more structured approach. Start small, observe execution behavior, and only scale once you’re consistent.
Before You Choose Any Platform
Before choosing any platform, it’s important to understand how execution speed, timing, and risk exposure actually affect your results.
That’s exactly why the Becoin trading framework was created.
It’s designed to help you:
Avoid common beginner mistakes
Understand how platforms really behave under pressure
Build a structured approach instead of guessing
This is not theory. It’s based on actual testing behavior across multiple platforms.
👉 If you don’t understand execution and risk, even the best broker won’t save your capital.
Best Choice for You (Fast Decision)
If you want the simplest possible start, Quotex is the best option.
If you want more tools and flexibility after gaining basic experience, Pocket Option fits better.
If you care about long-term stability and structured trading, Deriv is the stronger choice.
If you’re still asking “which broker should I choose,” the answer is simple: Start small, test the platform, and verify withdrawals before committing more capital.
Risk Awareness (Important)
Binary options trading is high-risk by nature.
No platform removes that risk.
A good platform only ensures:
Your trades execute properly
Your withdrawals are processed
Your experience is stable
It does not guarantee profits.
Your first goal should never be making money. It should be understanding how the platform behaves and protecting your capital while learning.
FAQ
Which broker should I choose as a beginner?
Quotex is the easiest starting point due to its simplicity and lower learning curve.
What is the best trading platform for small deposit?
Quotex and Pocket Option both support small deposits, but Quotex is more beginner-friendly.
Do these platforms actually pay withdrawals?
Yes. These recommendations are based on practical testing behavior, not promotional claims.
If you’re serious about trading, platform choice is just the first step.
What actually determines your results is:
How you manage risk
How you execute trades
How you adapt to platform behavior
That’s what Becoin Premium is built for.
Inside, you get:
Deeper broker testing insights
Structured trading frameworks
Real execution behavior breakdowns
Risk systems designed for small accounts
👉 Join Becoin Premium and start trading with a structured, tested approach instead of guessing.
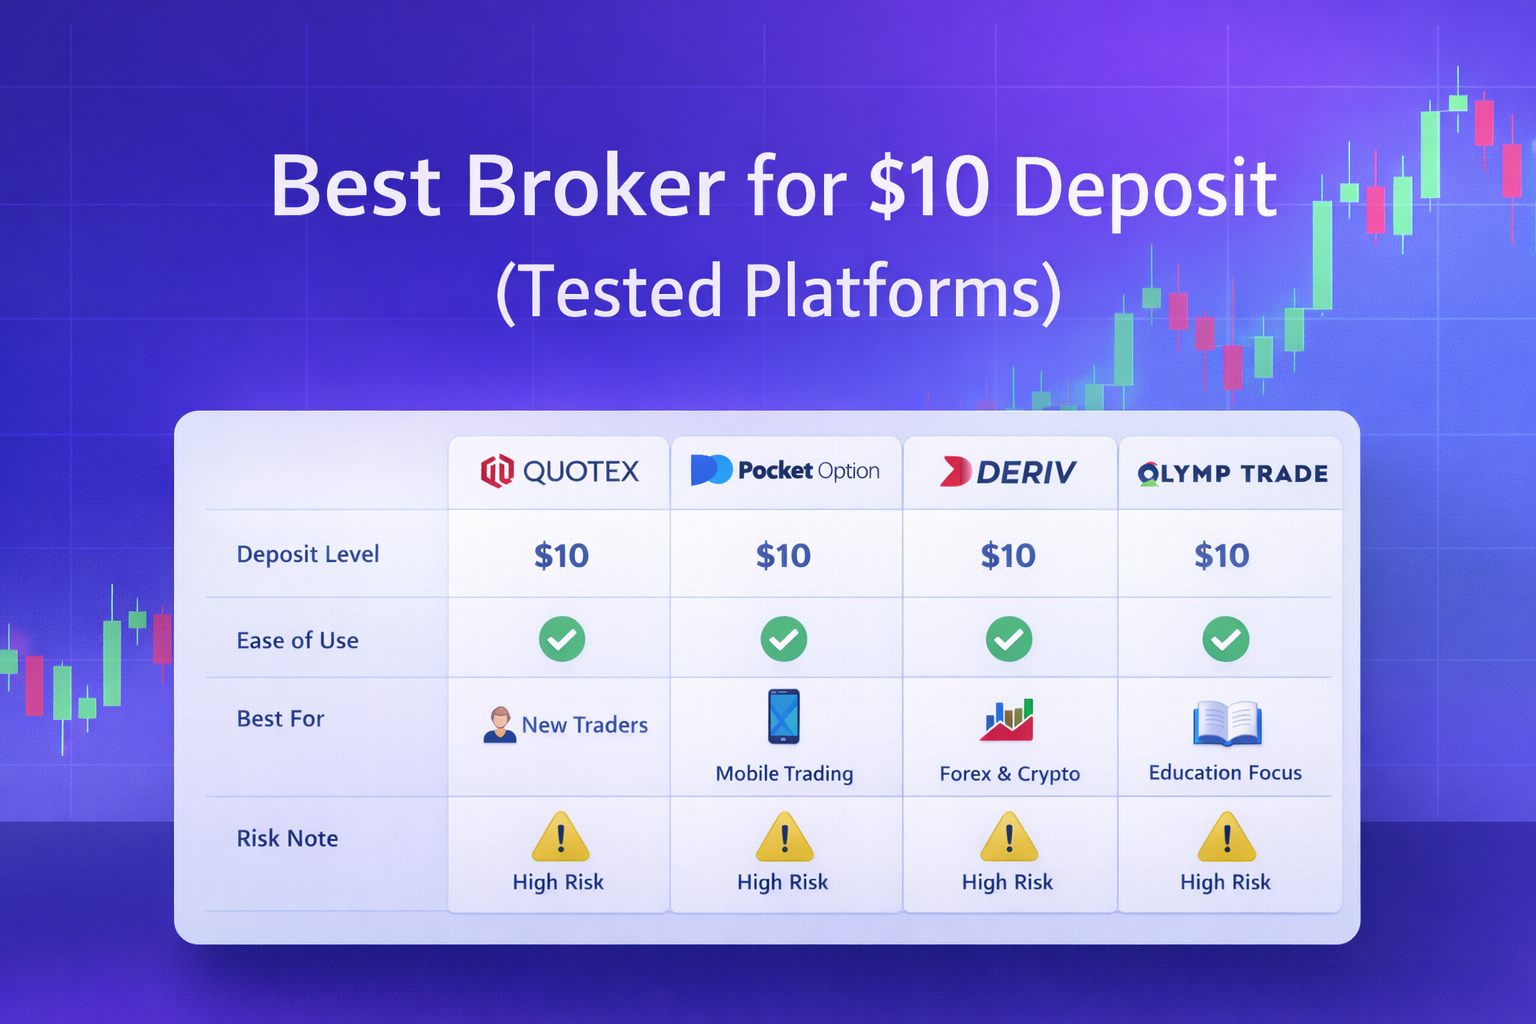
Best Broker for $10 Deposit (Tested Platforms – 2026)
If you are starting with a $10 deposit, choosing the wrong broker will cost you more than the market itself. Most platforms look similar, but execution speed, withdrawal behavior, and usability are very different in practice.
This page is designed to help you make a fast, clear decision. No unnecessary details. Only tested platforms that work for small deposits.
If your goal is to find the best broker for beginners, or the best trading platform for small deposit, start here.
Quotex – Best Overall for Beginners
Quotex is the most balanced option for users starting with small capital. The platform focuses on simplicity and execution, which is critical for short-term trading.
Why it works for $10 deposits:
Low entry barrier with smooth onboarding
Clean and simple interface
Fast execution suitable for short trades
Consistent withdrawal behavior when used correctly
Risk note:
It lacks advanced tools, so experienced traders may outgrow it.
This platform is suitable for beginners due to simpler execution and lower entry requirements. Start with a small deposit to test execution consistency before scaling.
Pocket Option – Best for Features and Flexibility
Pocket Option offers more tools and flexibility while still allowing small deposits. It is suitable for users who want more control early on.
Why it works for $10 deposits:
Low minimum deposit
Access to multiple assets
Social trading features (use carefully)
Flexible deposit and withdrawal options
Risk note:
Too many features can lead to overtrading if discipline is not maintained.
If you want more control and flexibility, this platform is a strong option. Try the demo first, then move to a small real deposit.
Deriv – Best for Long-Term Growth
Deriv is a better choice if you are thinking beyond basic binary options trading. It offers multiple platforms and more structured trading environments.
Why it works for $10 deposits:
Supports small deposits
Multiple trading interfaces
Better for strategy-based trading
Risk note:
There is a learning curve compared to simpler platforms.
This is ideal if you want to avoid switching platforms later. Start small and test execution before increasing capital.
Olymp Trade – Best for Guided Beginners
Olymp Trade focuses on simplicity and structured learning, making it suitable for complete beginners.
Why it works for $10 deposits:
Beginner-friendly interface
Educational tools available
Stable and simple environment
Risk note:
Less flexibility compared to other platforms.
This works well if you prefer a guided start. Use the demo first, then test real trading with a minimum deposit.
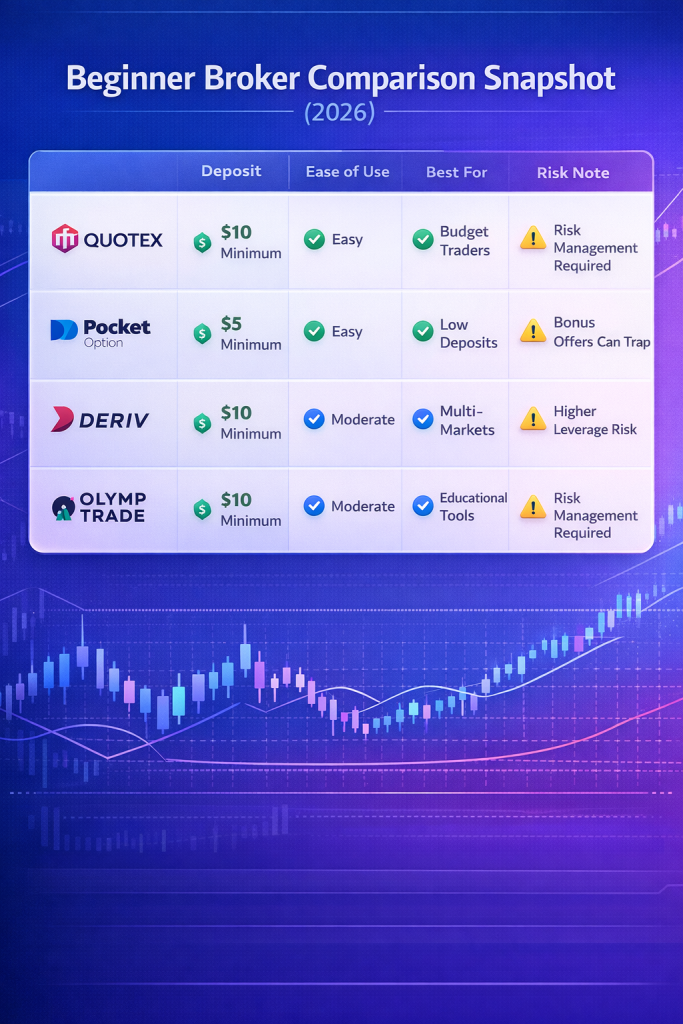
Comparison Table: Best Trading Platform for Small Deposit
Platform
Min Deposit
Ease of Use
Best For
Risk Note
Quotex
$10
Very Easy
Fast execution beginners
Limited advanced tools
Pocket Option
$10
Easy
Features and flexibility
Overtrading risk
Deriv
$10
Medium
Long-term growth
Learning curve
Olymp Trade
$10
Very Easy
Guided beginners
Limited flexibility
Common Mistakes When Choosing a Broker
Most beginners lose money before they even start trading properly. The issue is not strategy, it is platform selection and behavior.
Avoid these mistakes:
Depositing without testing execution
Ignoring withdrawal rules
Accepting bonuses without understanding restrictions
Switching platforms too quickly
For users starting with small capital, understanding basic capital safety is covered in beginner risk management guides, which explain how early losses usually happen.
Important: How to Evaluate a Broker Properly
Before choosing any platform, it is important to understand how execution and risk exposure affect your results. Entry timing, slippage, and payout structure all matter more than most beginners realize.
That is why the Becoin trading framework was created for structured decision-making based on real testing behavior.
Best Broker for Beginners (Quick Decision Guide)
If you want the simplest and safest start, choose Quotex. If you want more features and flexibility, choose Pocket Option. If you are thinking long-term, choose Deriv. If you want a guided experience, choose Olymp Trade.
Do not overanalyze. Choose one platform and test it properly.
How to Use a $10 Deposit Effectively
A small deposit should be used for testing, not profit expectations.
Follow this approach:
Start with a demo account
Deposit the minimum amount
Trade with small position sizes
Test withdrawal early
Withdrawal behavior differences are explained in platform payout analysis breakdowns, which help identify reliable platforms.
Frequently Asked Questions
Which broker should I choose as a beginner?
Quotex is generally the best choice for beginners due to its simplicity and execution speed.
Is $10 enough to start trading?
Yes, but only for testing and learning. It is not enough for consistent profit.
What is the best trading platform for small deposit?
Quotex, Pocket Option, and Deriv are the most suitable options based on usability and entry requirements.
Can I withdraw small profits?
Yes, but only if you follow KYC rules, use the same payment method, and avoid bonus restrictions.
What is the best binary options platform in 2026?
For beginners, Quotex is the best choice. For flexibility, Pocket Option. For long-term growth, Deriv.
Risk Awareness
Binary options trading is high risk. A small deposit reduces potential loss but does not eliminate risk.
Your goal with a $10 deposit should be:
Test the platform
Understand execution
Learn trading behavior
Not:
Expect fast profits
Recover losses quickly
Trust Statement
These recommendations are based on practical testing behavior, not promotional claims.
Final Call to Action
If you want deeper broker analysis, structured risk systems, and real testing insights:
Join Becoin Premium for advanced guidance designed to help you make safer trading decisions.
Choose one platform. Start small. Test properly.
Best Binary Options Brokers for Beginners (2026) — Fast Decision Guide
If you’re searching for the best binary options brokers for beginners, the real problem isn’t lack of options, it’s choosing the wrong platform and learning that mistake after you deposit.
Most beginners don’t fail because of strategy. They fail because they start on a broker that has unclear execution, weak withdrawal behavior, or confusing conditions.
This page is designed to help you decide quickly.
No theory. No overload. Just platforms that actually fit beginner behavior in 2026.
1. Quotex — Best for Simple Execution + Fast Start
Quotex is widely chosen by beginners because the interface is clean, execution is fast, and it removes unnecessary complexity.
Why it fits beginners:
Very simple trading interface
Low minimum deposit (good for testing small capital)
Fast trade execution (important for short-term decisions)
Demo account available for practice
Strengths:
Beginner-friendly UI
Smooth mobile + web experience
Easy asset selection
Risk note (important): Withdrawals and bonuses can behave differently depending on account activity and verification timing. Always test with small capital first.
For users starting with small capital, understanding basic capital safety habits is essential before scaling—this is covered in beginner risk management guides inside Becoin resources.
👉 Open your account with a small deposit to test execution before increasing exposure.
2. Pocket Option — Best for Features + Social Trading Style
Pocket Option is popular among beginners who want more tools, indicators, and optional social trading features.
Why it fits beginners:
Copy/social trading options available
Low entry requirement
Flexible payout structure
Demo trading included
Strengths:
Feature-rich platform
Beginner-friendly deposit levels
Active global user base
Risk note: More features can lead to overtrading. Beginners often take too many trades instead of focusing on discipline.
Withdrawal behavior differences are explained in platform payout analysis breakdowns that help users understand timing and consistency patterns before committing larger capital.
👉 Open demo account first, then move to small live trades only when consistent.
Mid-Page Decision Insight (Important)
Before choosing any platform, it’s important to understand how execution and risk exposure actually affect results. That’s why I created the Becoin trading framework for structured decision-making.
If you don’t understand platform behavior first, even the “best broker” will feel random.
3. Deriv — Best for Stability + Long-Term Platform Trust
Deriv is one of the more established names and is often used by users who want a more stable environment rather than hype-driven features.
Why it fits beginners:
Long-standing platform reputation
Multiple trading instruments beyond binaries
Stable infrastructure
Good for structured learning approach
Strengths:
Platform stability
Broader trading ecosystem
Suitable for gradual skill building
Risk note: Interface is slightly more complex than pure beginner platforms, so there may be a learning curve.
👉 Open your Deriv account as it’s the best used when you want to move beyond pure “click trading” into structured practice.
4. Olymp Trade — Best for Guided Beginner Experience
Olymp Trade focuses heavily on beginner onboarding and structured learning flow.
Why it fits beginners:
Guided interface experience
Educational structure inside platform
Low minimum deposit options
Clear trade setup flow
Strengths:
Beginner onboarding support
Simple trade execution
Clean platform design
Risk note: Guided systems can create overconfidence. Real market behavior still requires discipline and risk control.
👉 Open account and start small and focus on consistency rather than frequency.
If you want step-by-step guided learning → Olymp Trade
If you’re still unsure, the safest approach is simple: 👉 Start with the lowest deposit possible and test execution first.
Risk Awareness (Read Before Choosing)
Binary options trading is fast-paced and high-risk. The biggest beginner mistake is not strategy—it’s emotional execution.
Key risks:
Overtrading after small wins
Chasing losses
Ignoring withdrawal verification rules
Switching platforms too quickly
For structured control approaches, beginner risk frameworks inside Becoin help users avoid impulsive decision cycles.
FAQ — Best Binary Options Brokers for Beginners (2026)
1. Which is the best broker for beginners in 2026?
Quotex and Olymp Trade are generally the easiest starting points due to simple interfaces and low deposit requirements.
2. Which is the best trading platform for small deposit?
Pocket Option and Quotex both support low entry capital, making them suitable for testing before scaling.
3. Which platform is safest for beginners?
No binary options platform is risk-free. Stability depends more on user behavior, verification, and disciplined trading than the broker alone.
4. Which broker should I choose first?
Start with the one that matches your style:
Simplicity → Quotex
Features → Pocket Option
Stability → Deriv
Final Decision Summary
If you are a beginner in 2026, your goal is not to find the “perfect broker.”
Your goal is to find:
Simple execution
Low entry barrier
Stable withdrawal behavior
A platform you can test safely
Everything else comes later.
Join Becoin Premium for deeper broker analysis, risk systems, and real testing insights designed for safer trading decisions.
Trust Note: These recommendations are based on practical testing behavior, not promotional claims.
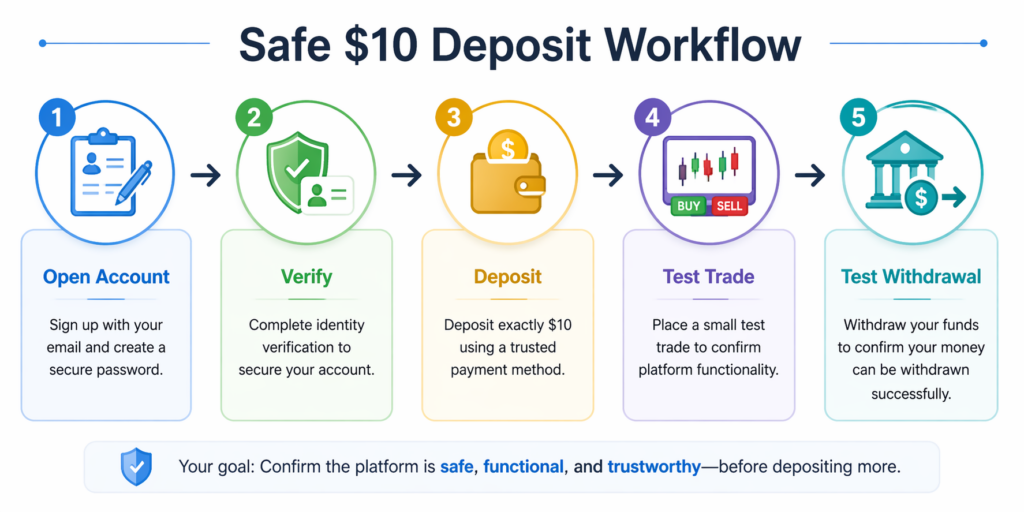
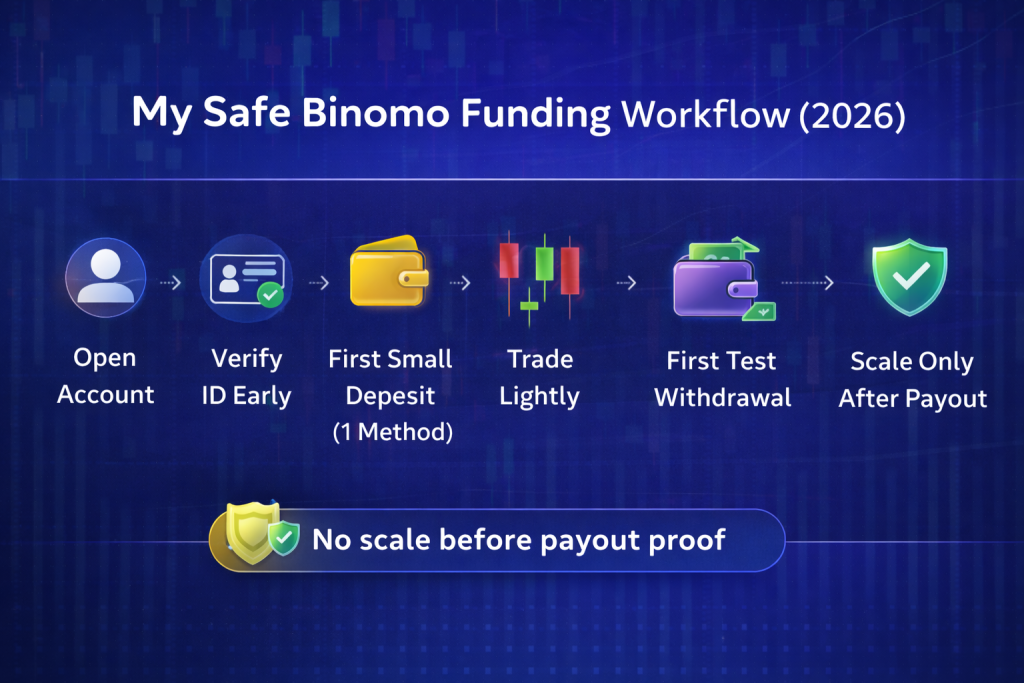
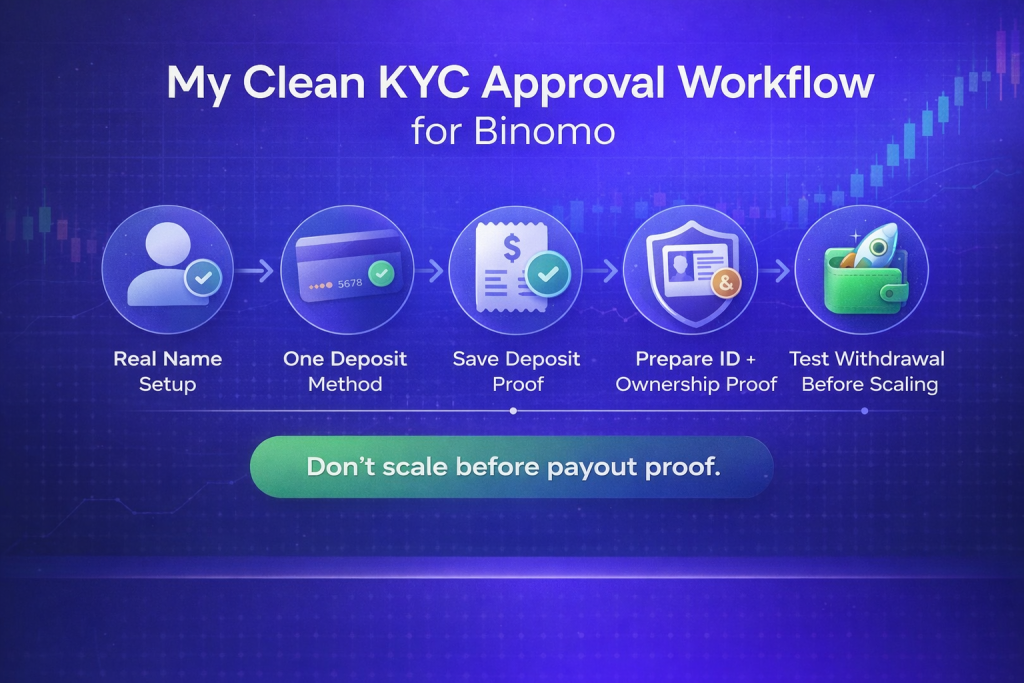
Binomo First $10–$50 Test Deposit Plan: The Safest Way to Validate the Platform Before Scaling
I didn’t start with confidence. I started with doubt.
Every time I searched for answers about Binomo, I found opinions, not proof. Some people claimed fast withdrawals. Others complained about delays. But almost nobody showed a complete journey from deposit to withdrawal using real money.
So I stopped reading and started testing.
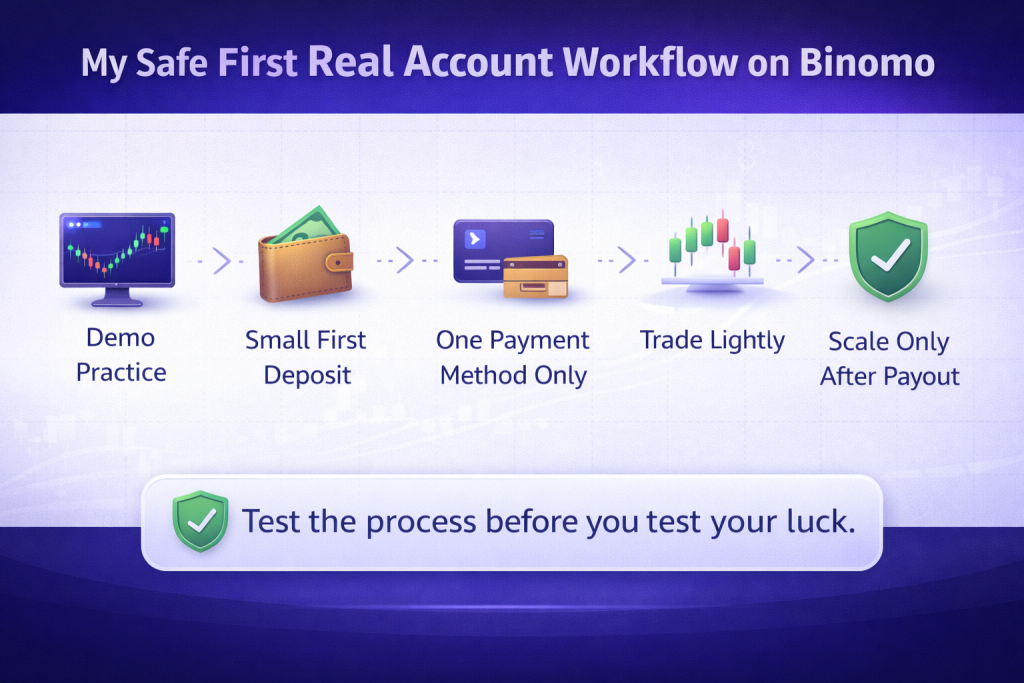
Instead of risking a large amount, I built a simple rule for myself. I would validate everything using a small, controlled deposit between $10 and $50. No pressure to win. No rush to grow. Just a structured way to see how the platform actually behaves.
If you’re planning to try Binomo, don’t skip this phase. Start with a test deposit the same way I did. You can begin your own controlled test here using my recommended entry point: Start your safe Binomo test deposit
Why I Built My Own $10–$50 Validation System
The biggest gap in most guides is simple. They don’t show what happens step by step when real money is involved.
I wanted answers to very specific questions:
Will my deposit method actually work smoothly
Will my account pass verification without issues
Can I withdraw without delays
How does trading feel with real money instead of demo
That’s where the Binomo First $10–$50 Test Deposit Plan became useful. It’s not a strategy to make money. It’s a system to remove uncertainty.
Before depositing, I also reviewed what actually works in my region. This breakdown of payment methods that actually work in Pakistan and nearby countries helped me avoid early mistakes.
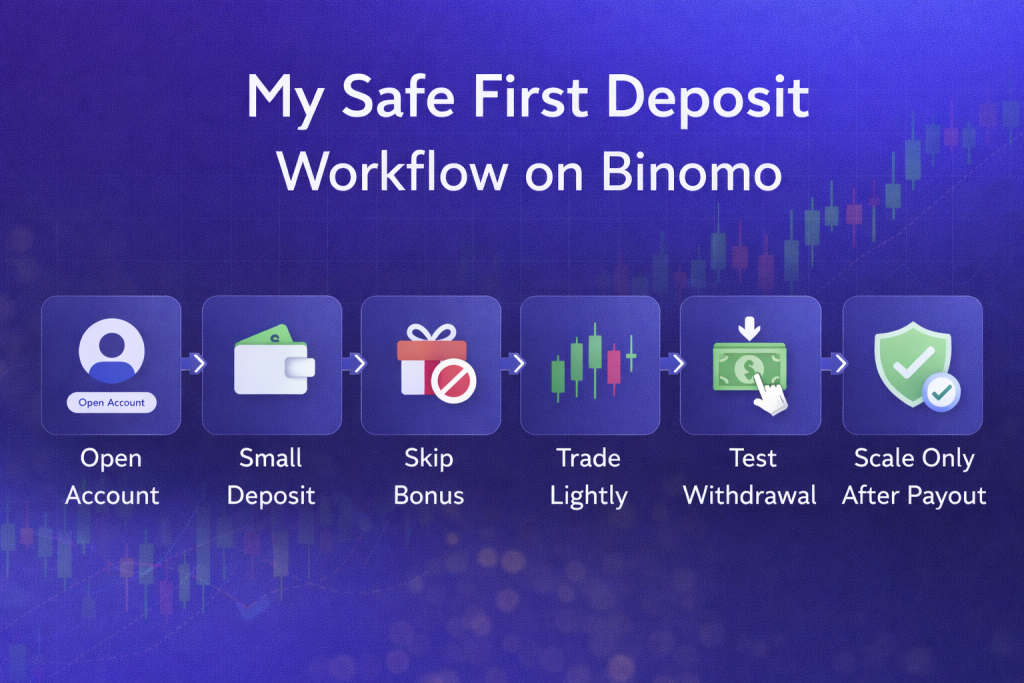
My First Deposit: Keeping It Small on Purpose
I deposited $20.
Not because I had to, but because I didn’t want emotions interfering with decisions. A small deposit keeps your thinking clear.
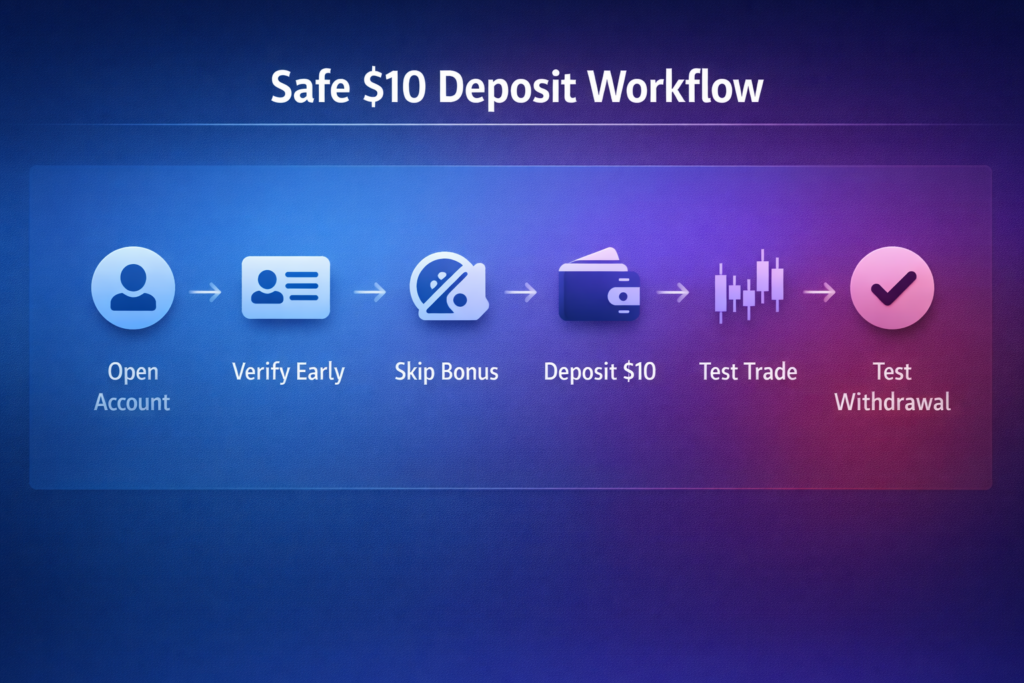
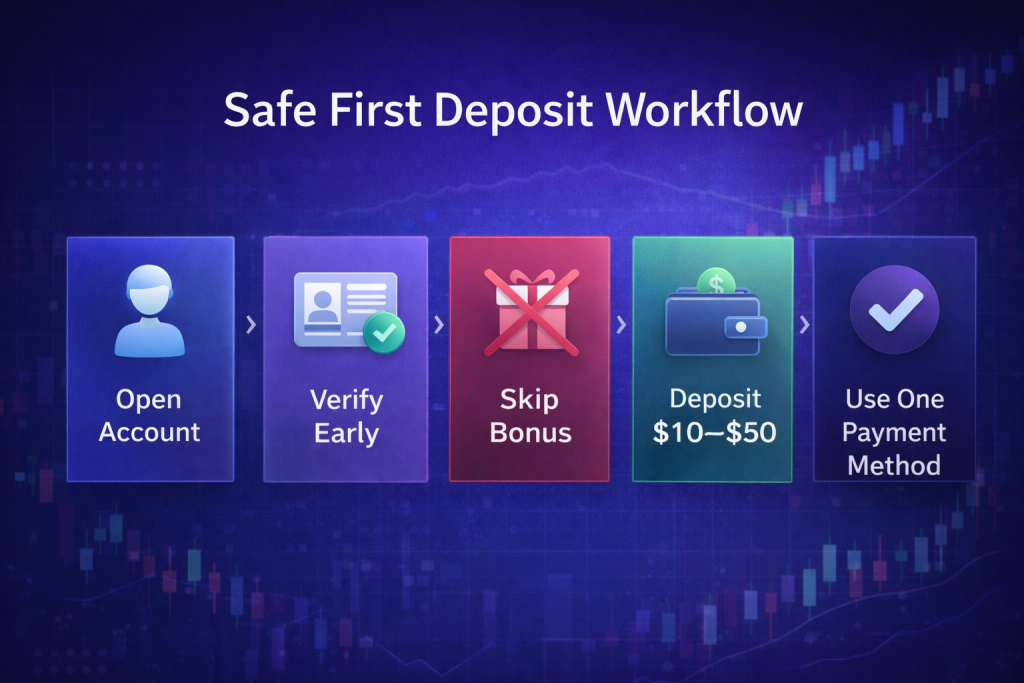
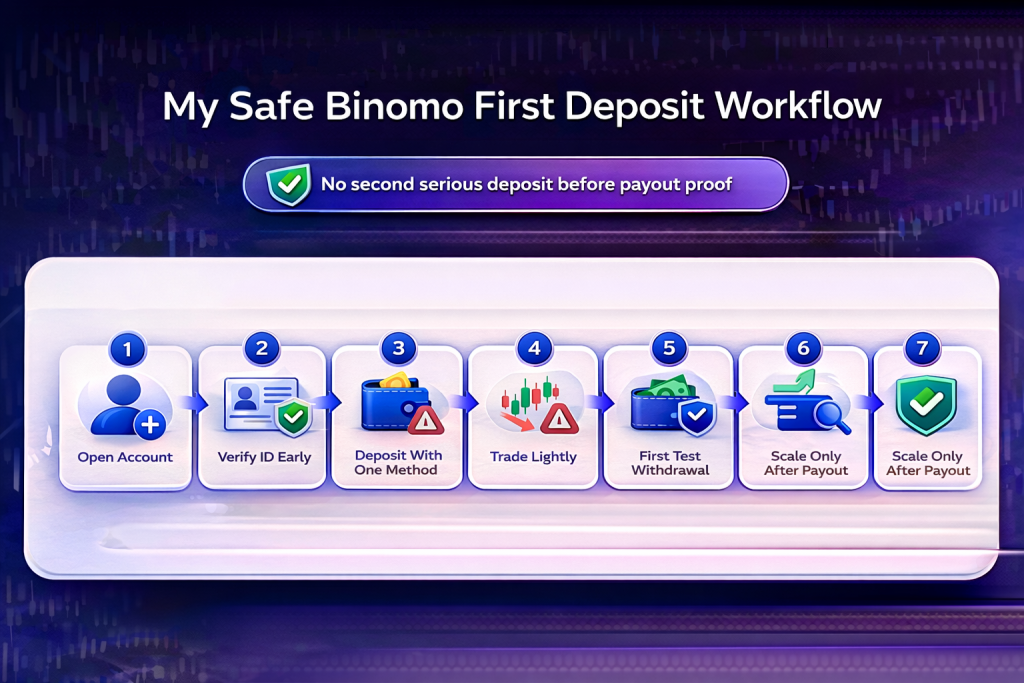
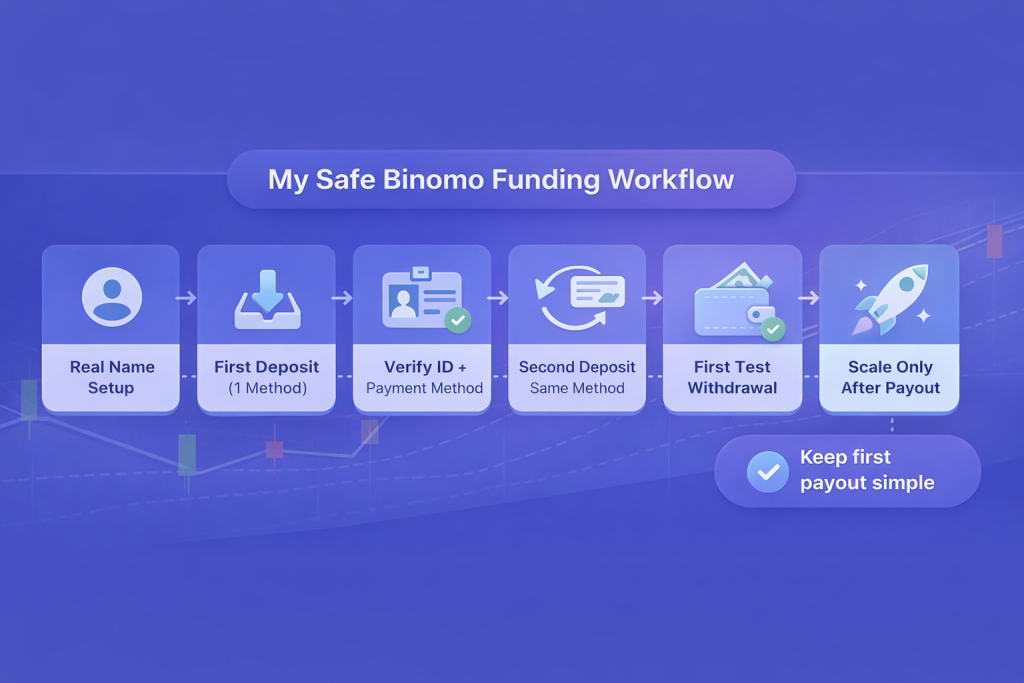
I followed a strict structure:
Step
Action
Why It Matters
1
Open account
Clean start
2
Verify early
Avoid withdrawal delays
3
Skip bonus
Keep funds withdrawable
4
Deposit $20
Controlled risk
5
Use one method only
Prevent payout issues
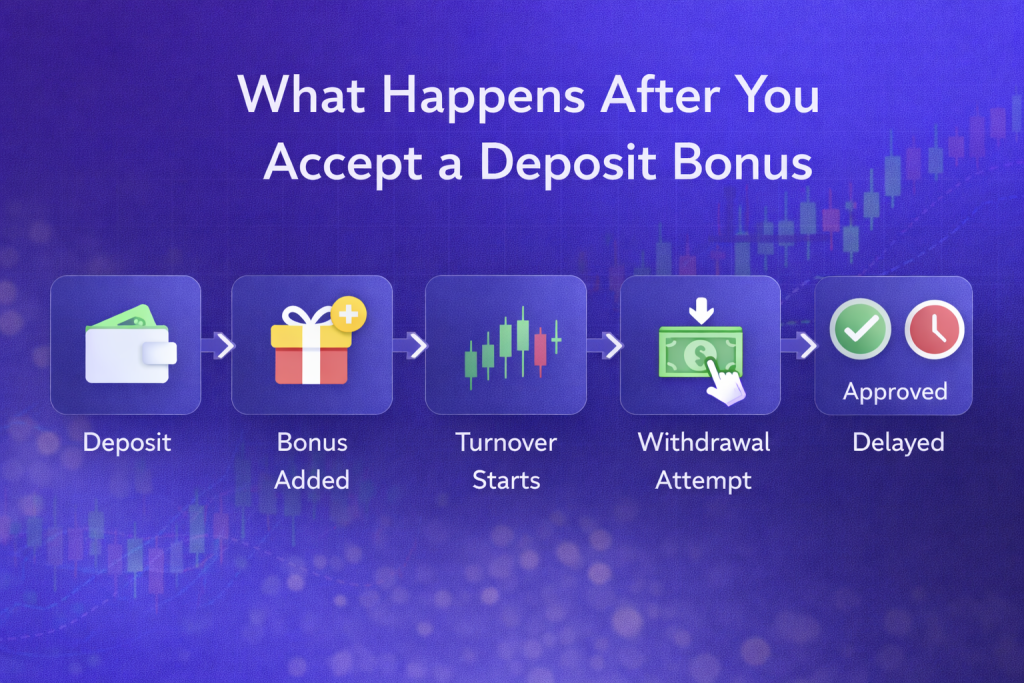
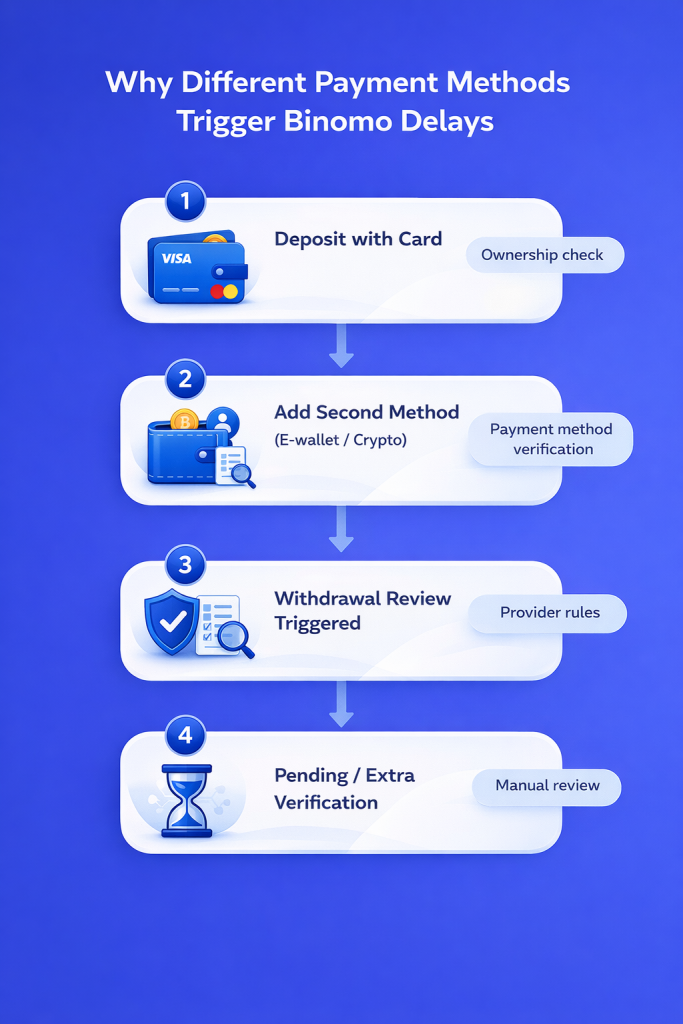
Skipping the bonus was a conscious decision. I had already learned how bonus terms can delay or block withdrawals, so I didn’t want unnecessary restrictions on my first test.
Another important detail I followed was using a single payment method. I had already seen how using different deposit and withdrawal methods causes delays, so I avoided that mistake from the beginning.
My First Trades: Observing, Not Chasing Profit
Once the deposit was in, I didn’t jump into aggressive trading.
I placed small trades between $1 and $2. My goal wasn’t to grow the account. It was to observe how things actually work under real conditions.
Here’s what I focused on:
Trade execution timing
Price movement consistency
My own emotional reactions
The shift from demo to real trading was immediate. Losing even $1 feels different when it’s real money.
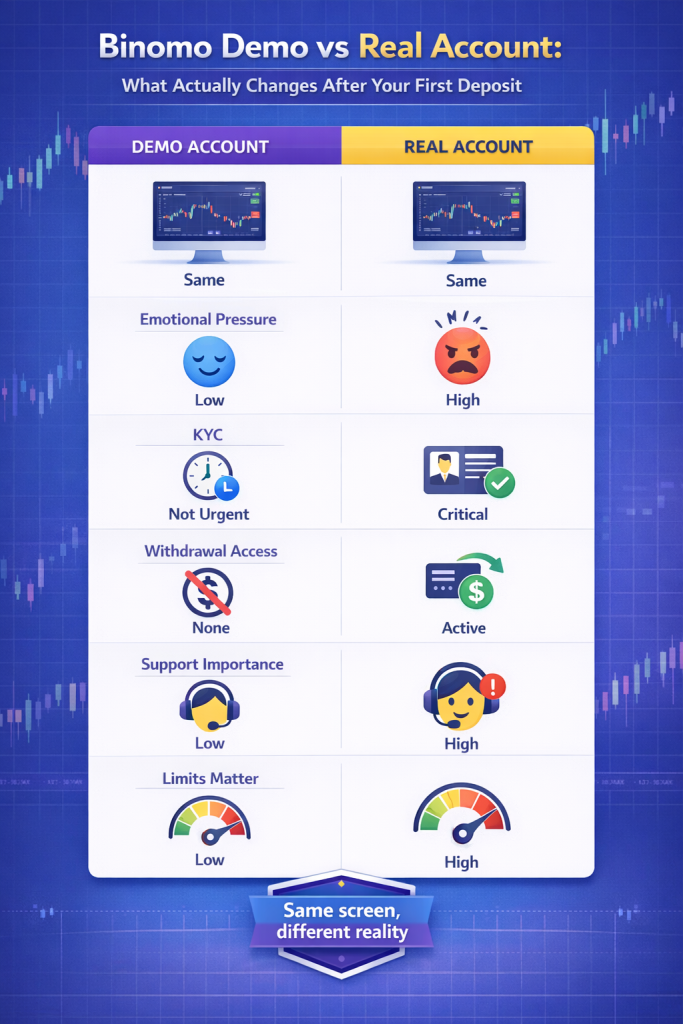
This is exactly where most traders lose control early. The difference between demo and real trading is not technical, it’s psychological. If you haven’t experienced that yet, this comparison of what actually changes after moving from demo to real account explains it clearly.
After about 20 trades, my balance dropped from $20 to around $17. That didn’t bother me.
Because this wasn’t about winning. It was about learning.
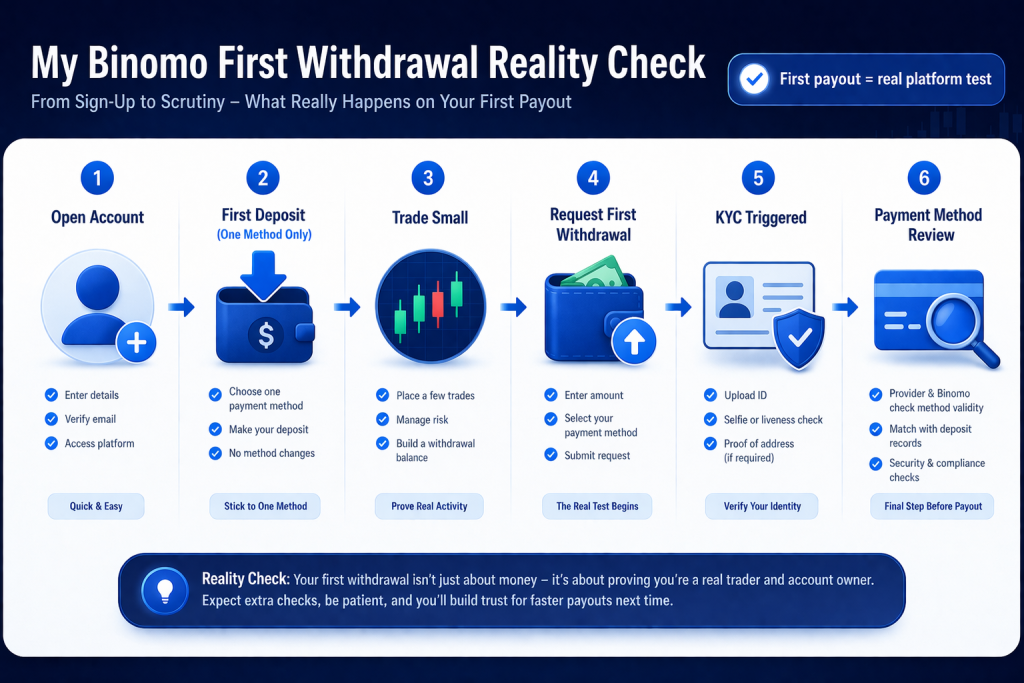
The Real Test: My First Withdrawal Attempt
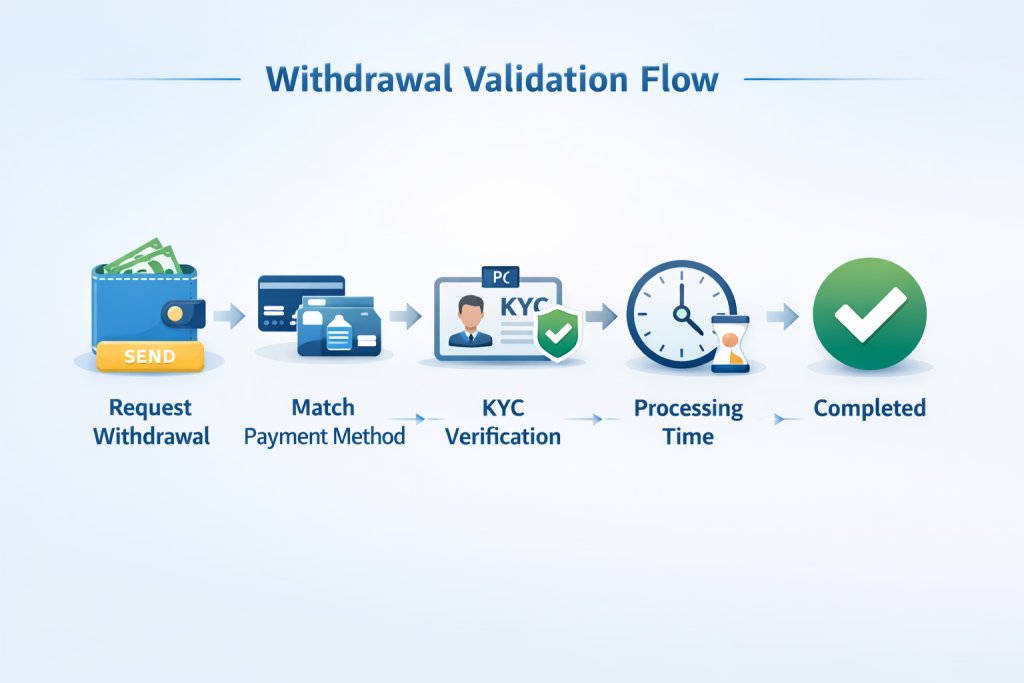
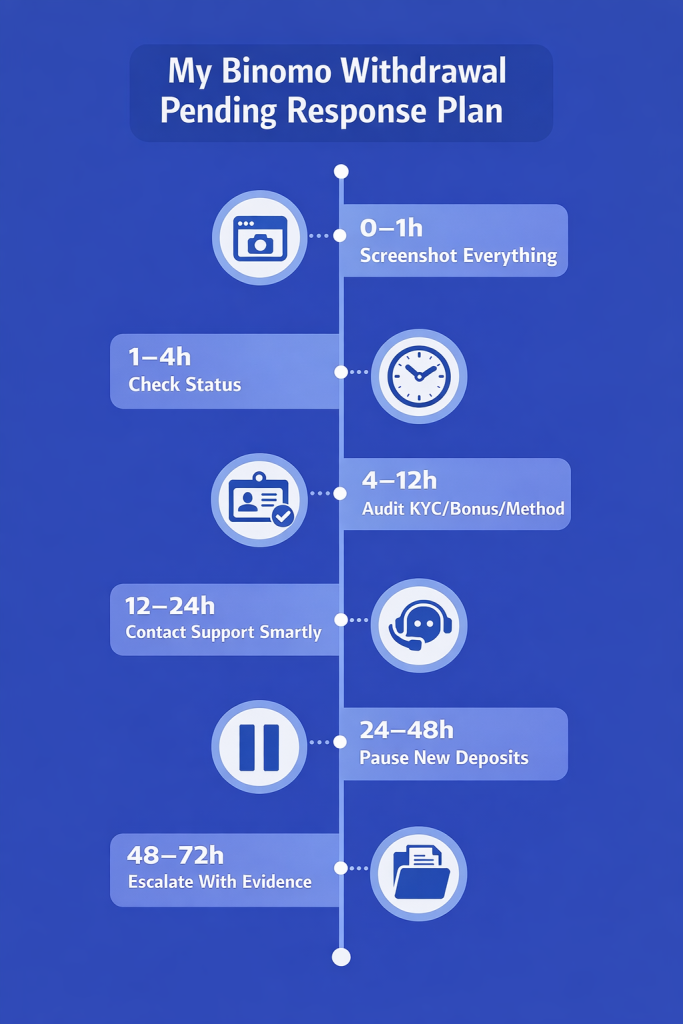
This is the step most people delay. I did it early.
I didn’t wait to grow my account. I requested a $10 withdrawal while my balance was still around $17.
Here’s exactly how I approached it:
Step
Action
Outcome
1
Request partial withdrawal
Test system early
2
Use same payment method
No mismatch
3
Submit KYC if required
Smooth process
4
Track processing time
Real insight
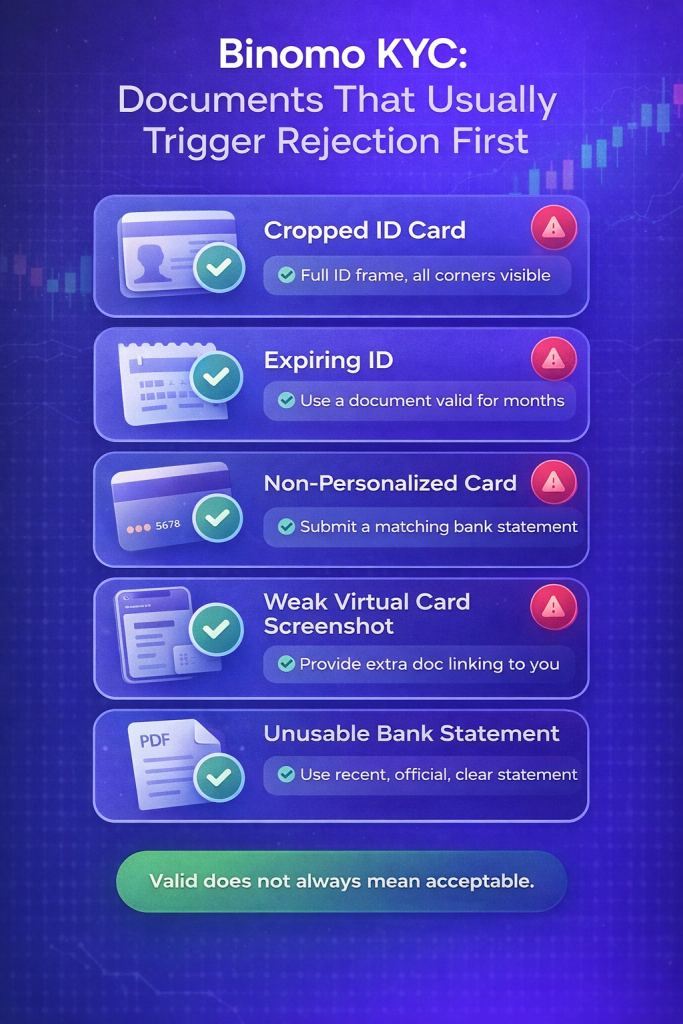
Before submitting documents, I made sure I understood which KYC documents usually get rejected, so I avoided common mistakes like unclear images or mismatched details.
The withdrawal didn’t come instantly, but it was processed within a reasonable timeframe.
That single step gave me more clarity than hours of reading reviews.
If you want to understand delays better, this guide on real withdrawal timelines and what happens at each stage is worth going through before your first request.
What That $20 Test Taught Me
By the time I completed the cycle, I had answers based on experience, not assumptions.
Here’s what changed for me:
I stopped worrying about platform legitimacy and focused on process
I confirmed that withdrawals actually work when done correctly
Most importantly, I realized that skipping this testing phase is the biggest mistake beginners make.
My Refined Binomo First $10–$50 Test Deposit Plan
After my first attempt, I repeated the process and refined it into a repeatable system.
This is the exact structure I now follow:
Phase
Action
Purpose
Setup
Open account + verify
Prevent delays
Deposit
$10–$50 only
Limit exposure
Bonus
Skip
Avoid restrictions
Trading
Light trades
Observe behavior
Withdrawal
Test partial payout
Validate system
Review
Analyze results
Decide next step
This simple cycle covers everything that matters.
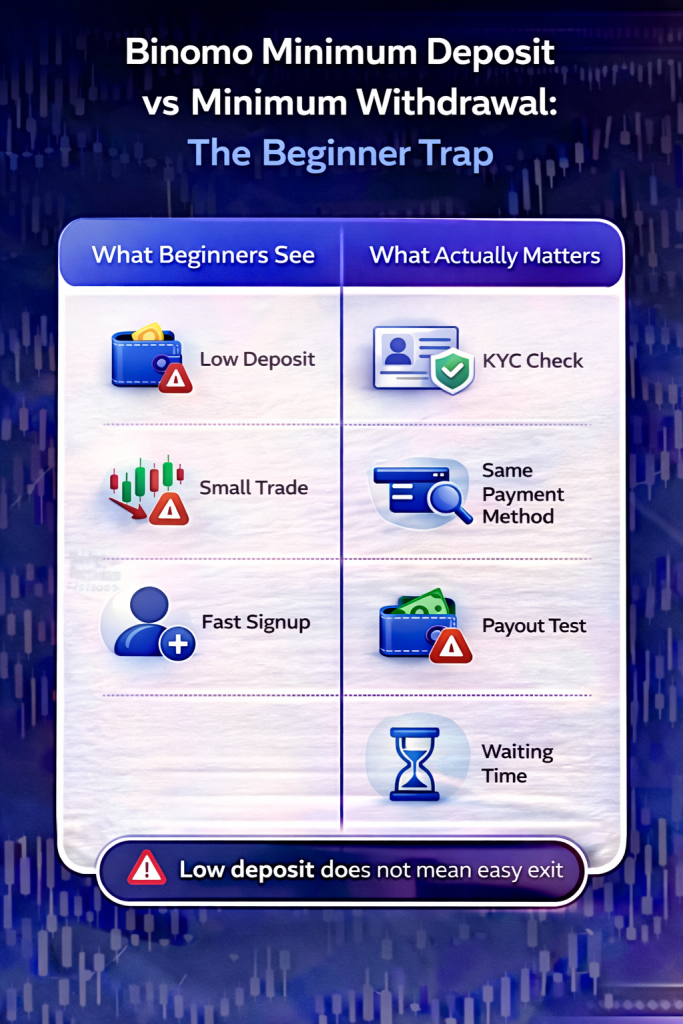
It also protects you from one of the most overlooked issues, which is the gap between minimum deposit and withdrawal expectations. Many traders misunderstand this, and this explanation of the minimum deposit vs withdrawal trap helped me avoid unrealistic assumptions.
The Mistake I Almost Made
At one point, I considered accepting a deposit bonus to increase my balance quickly.
It looked tempting.
More balance means more trades, right?
But after understanding how bonuses work, I realized it would delay my withdrawal test and complicate everything. That decision alone saved me time and frustration.
When I Decided to Scale
I didn’t increase my deposit after one successful withdrawal.
I repeated the full cycle again.
Second deposit: $30 Same method, same rules Another withdrawal test
Only after two clean cycles did I feel confident enough to scale.
That’s the difference between controlled growth and blind risk.
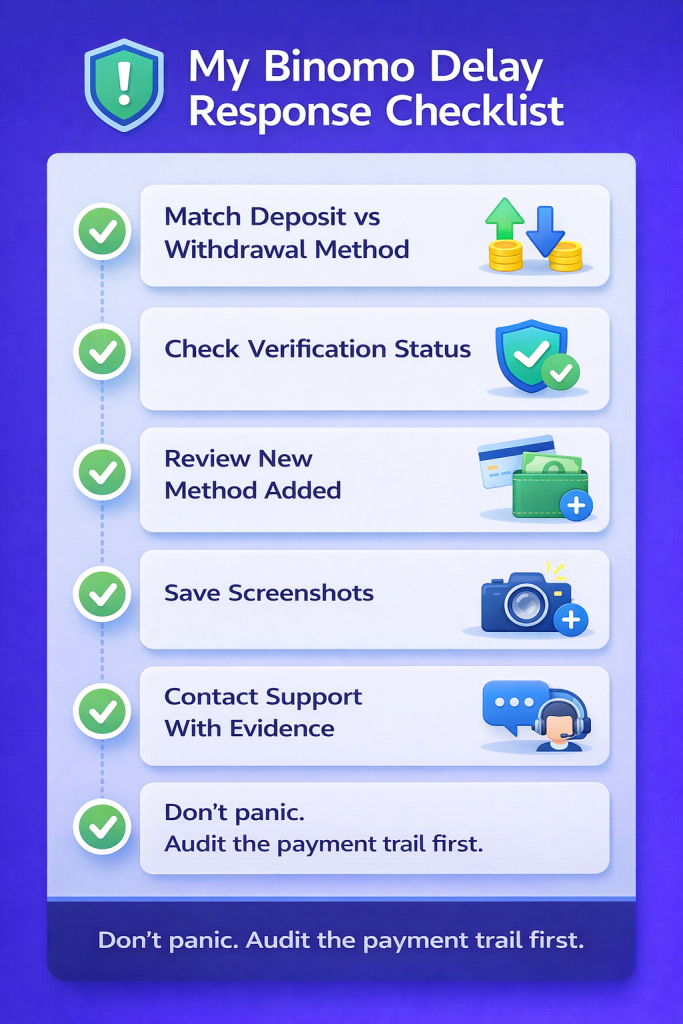
If something had gone wrong, I was also prepared. I had already reviewed how to contact support properly and what to send to avoid generic replies, which gave me an extra layer of confidence.
Final Thoughts: Your First Deposit Is Not an Investment
Most traders treat their first deposit like an opportunity to earn.
I treated mine like an audit.
That mindset changed everything.
Because when you remove the pressure to win, you start seeing clearly. You notice platform behavior, payment flow, and your own habits.
The Binomo First $10–$50 Test Deposit Plan is not about making money.
Is Binomo Safe or Risky in 2026? A Practical User Checklist (Not a Generic Review)
I still remember the first time I opened Binomo. It wasn’t excitement. It was hesitation.
I had already read multiple reviews. Some said it was safe. Others called it risky. None of them felt like they came from someone who had actually traded, deposited, withdrawn, and dealt with real friction.
So I decided to test it myself.
If you’re asking “Is Binomo safe or risky in 2026?”, I’ll answer it the way I figured it out, by using it, making mistakes, fixing them, and documenting what actually happens step by step.
👉 If you want to test it the same way I did, don’t overthink it. Create your account and start small here.
The First Deposit: Where Doubt Actually Begins
I didn’t deposit a big amount. I wasn’t trying to make money yet. I was trying to understand the system.
The deposit itself was instant. No issue there.
The real decision showed up right after that, the bonus.
I almost accepted it. It looked like free money. Then I paused and read the terms properly. That’s when I realized bonuses are not simple.
If you accept a bonus without understanding turnover conditions, it can directly affect your withdrawals later. I broke this down in detail when I tested it myself.
That was my first lesson.
The platform didn’t feel risky at that moment. My decisions did.
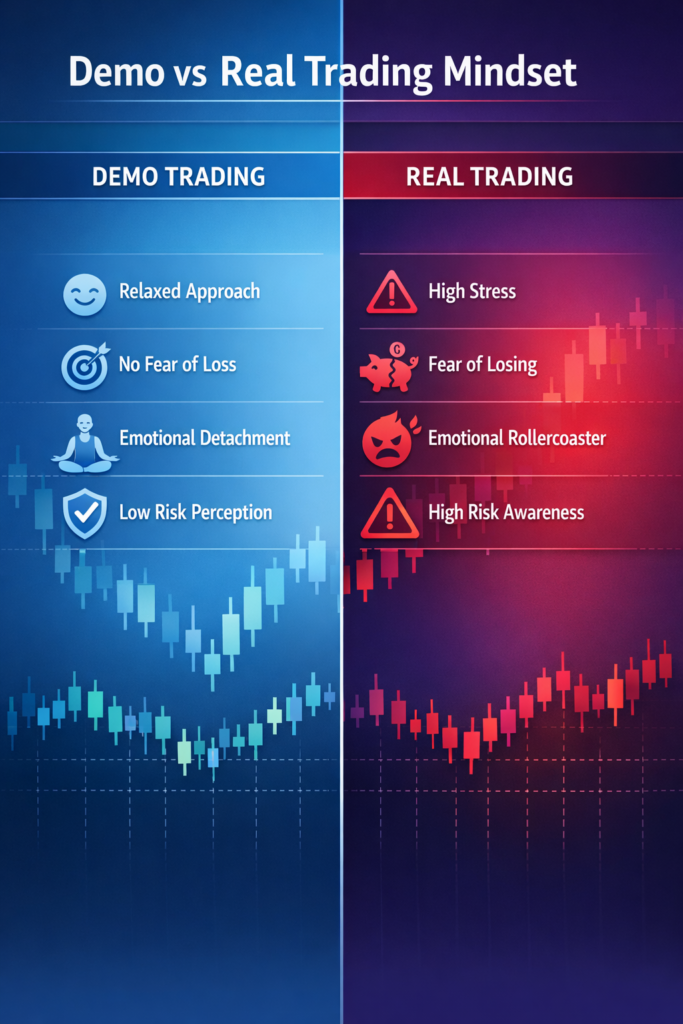
Demo vs Real: Where Confidence Breaks
Before depositing, I had already used the demo account.
On demo, everything felt controlled. I waited for setups. I followed logic. I wasn’t emotional.
The moment I switched to real money, everything changed.
I started:
Entering trades early
Increasing trade size after a loss
Trying to recover quickly
Same platform. Completely different behavior.
That’s why I always tell people to understand what actually changes between demo and real before judging safety. I documented this transition clearly here.
This is where many users start calling Binomo risky.
Not because of the platform, but because their behavior shifts under pressure.
The First Withdrawal: The Real Safety Test
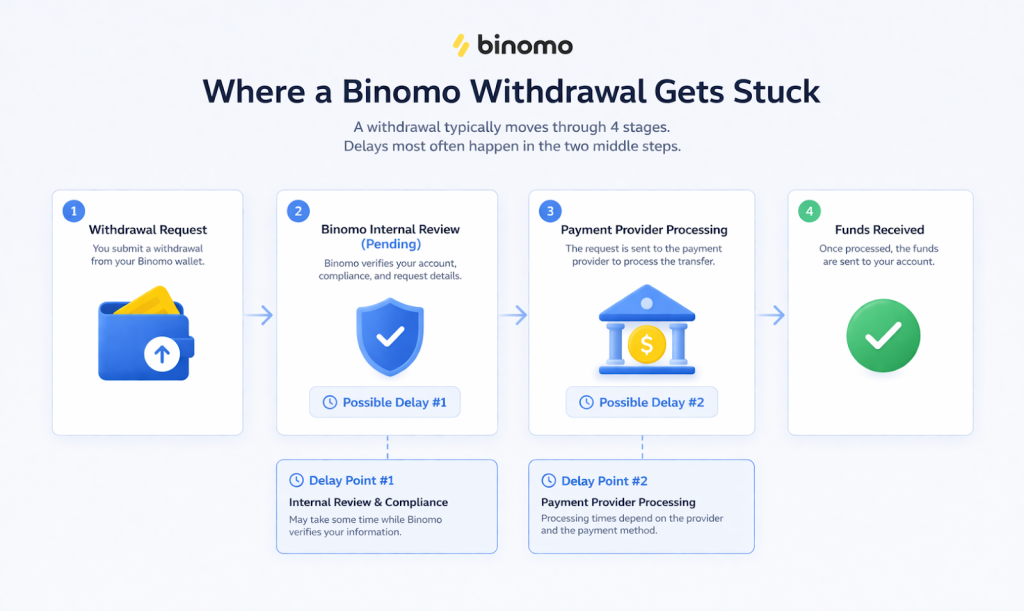
Deposits don’t prove anything. Withdrawals do.
I placed a small withdrawal request early, not because I had profits, but because I wanted to test the process.
Here’s what happened:
It didn’t process instantly
I was asked to verify my identity
My payment method needed confirmation
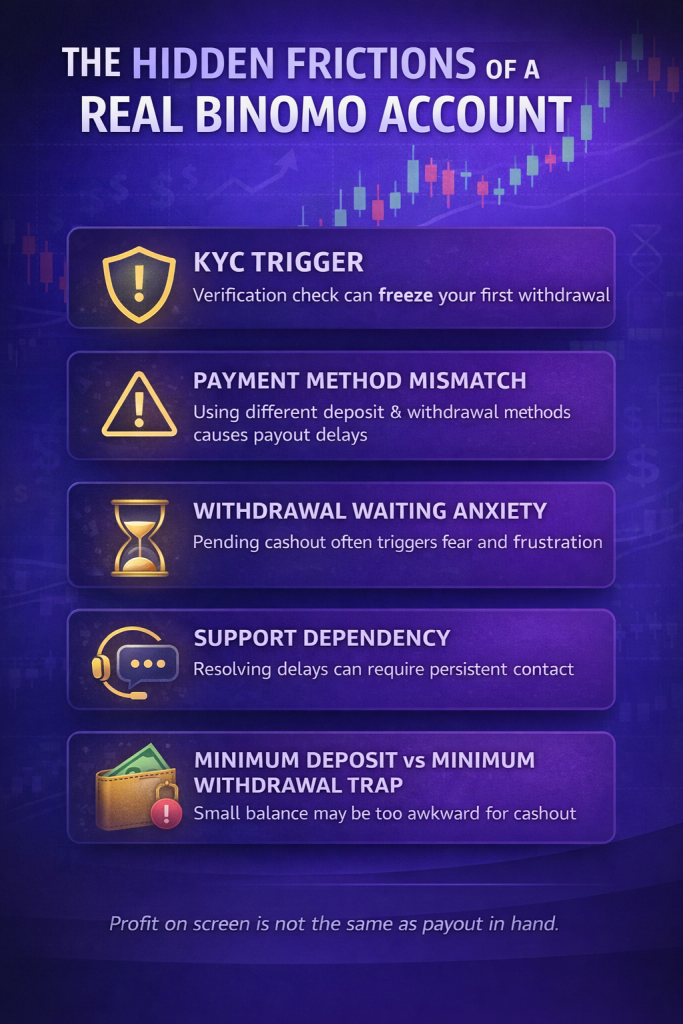
At first, it felt like friction. Later, it made sense.
Most complaints you see online come from this exact stage.
Usually because:
KYC is delayed until withdrawal
Payment methods don’t match
Or users don’t understand the timeline
If you want a realistic breakdown of what happens hour by hour during pending withdrawals, this helped me set expectations properly.
Once I completed verification properly, the withdrawal went through.
That’s when my perspective changed.
The real question wasn’t “Is Binomo safe or risky in 2026?”
It became “Am I using it in a safe or risky way?”
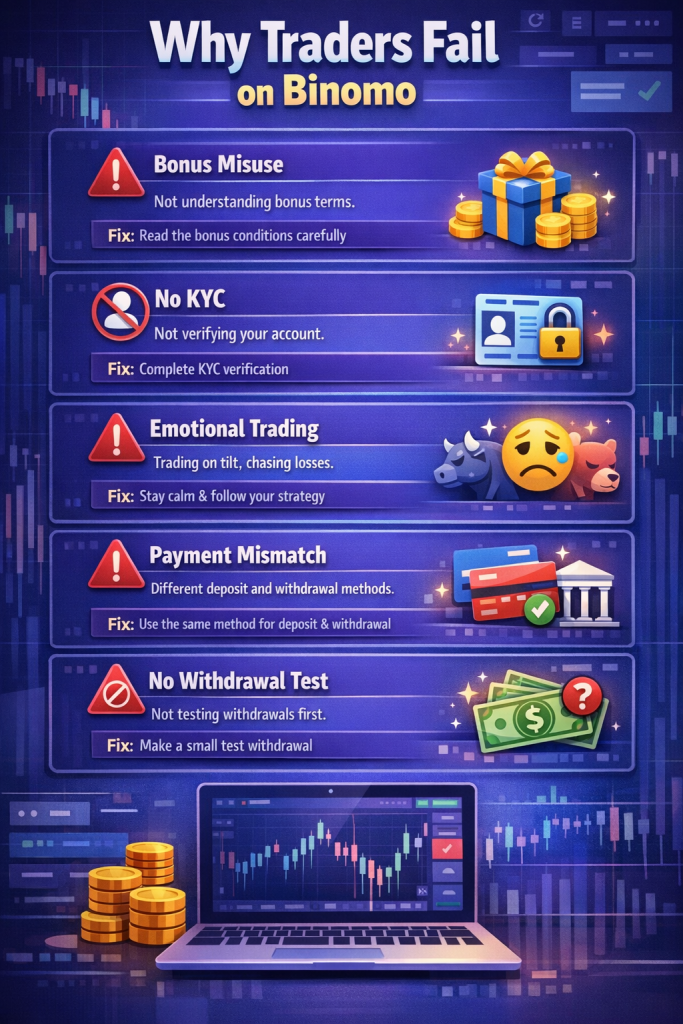
Where Most People Go Wrong
After using the platform for a while, patterns became very clear.
People weren’t facing random issues. They were repeating the same mistakes.
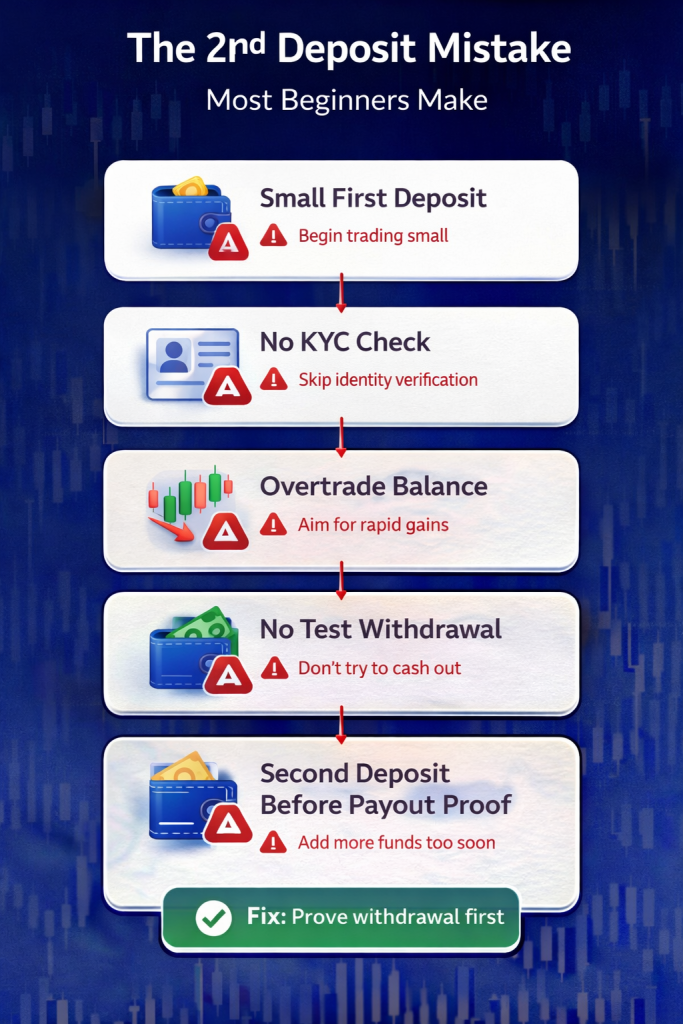
Behavior
Outcome
Accepting bonuses blindly
Withdrawal restrictions later
Using different deposit and withdrawal methods
Delays and verification issues
Skipping KYC early
Requests get stuck
Trading emotionally
Fast losses
Not testing withdrawals
Bigger problems later
One mistake I personally saw often was using different payment methods for deposit and withdrawal. It looks harmless, but it creates unnecessary complications. I explained why this causes delays here.
Again, the platform didn’t randomly fail. The setup did.
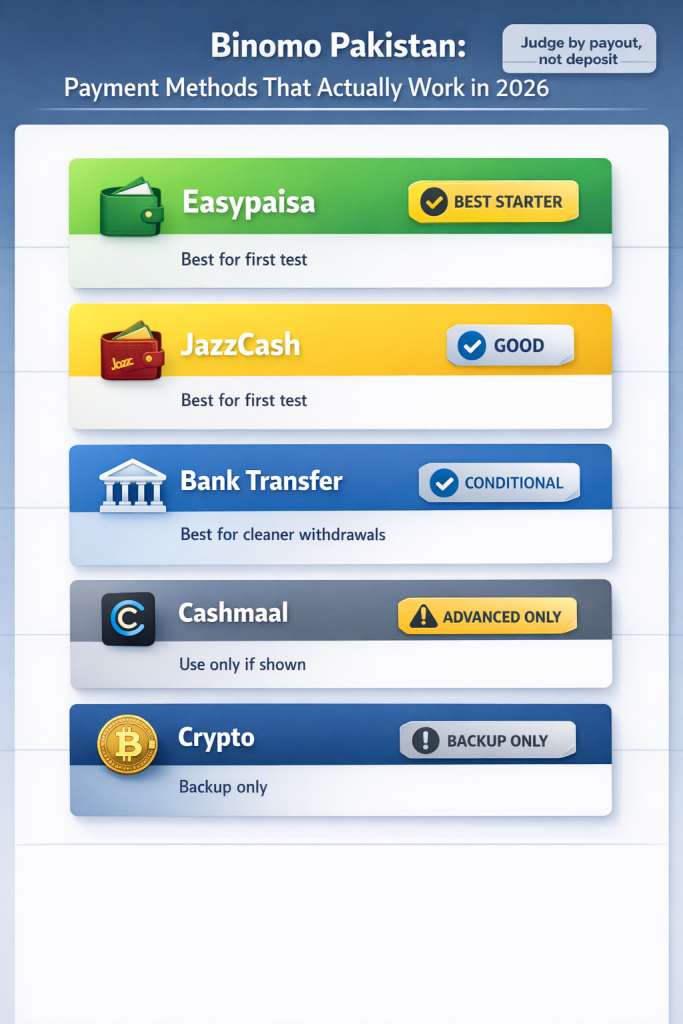
Payment Methods in 2026: What Actually Works
Since I’m trading from Pakistan, this part mattered more than anything else.
Not every payment method works smoothly both ways.
Some are fast for deposits but unreliable for withdrawals. Others are consistent.
After testing, I realized three things:
Stick to one method
Use your own verified details
Avoid switching mid-way
If you’re in Pakistan, India, or Bangladesh, I documented what actually works based on real usage here.
This alone can save you from most “delay” issues.
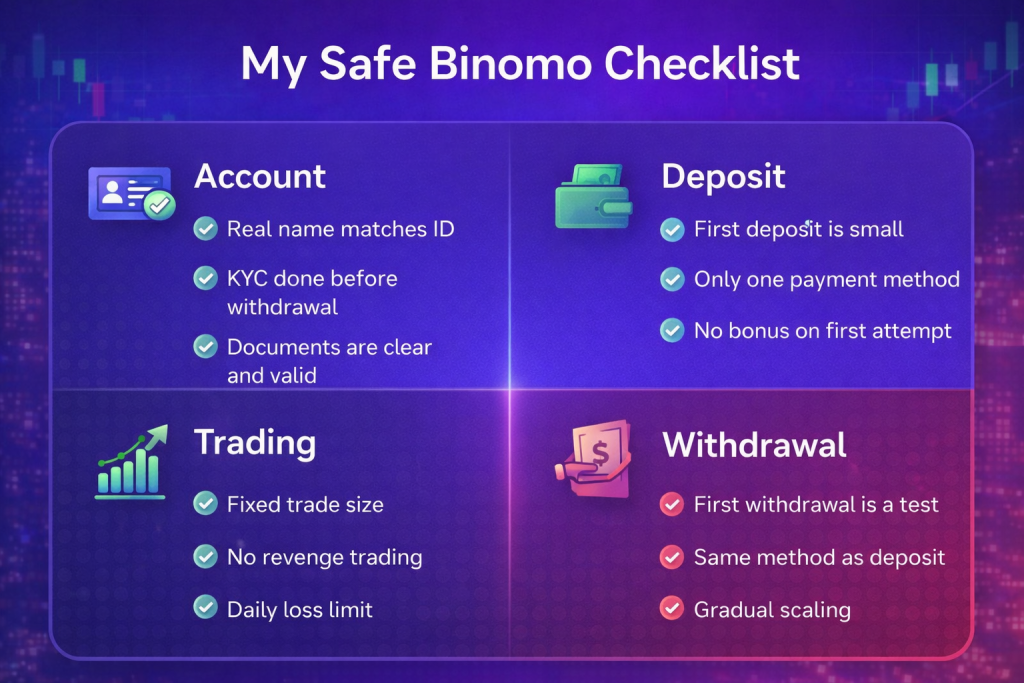
My Practical Safety Checklist (What I Follow Now)
After months of using Binomo, I stopped relying on opinions. I built a system.
Here’s the checklist I actually follow.
Account Setup
Real name matches ID
KYC done before withdrawal
Documents are clear and valid
If you’re unsure which documents get rejected most often, I’ve already covered the exact cases here.
Deposit Strategy
First deposit is small
Only one payment method
No bonus on first attempt
Trading Behavior
Fixed trade size
No revenge trading
Daily loss limit
Withdrawal Discipline
First withdrawal is a test
Same method as deposit
Gradual scaling
Another thing most beginners miss is the difference between minimum deposit and minimum withdrawal. It looks simple, but it traps a lot of new users. I explained that gap here.
This checklist is not theory. It’s what reduced my issues to almost zero.
The Psychological Risk No One Mentions
This is the part most reviews completely ignore.
They talk about platform safety. They don’t talk about trader behavior.
Binary trading is fast. That speed changes how you think.
I’ve had sessions where I doubled my balance in an hour. I’ve also had sessions where I lost everything right after.
The platform didn’t change.
My decisions did.
That’s the real risk.
Mid-Article Reality Check
If you’ve made it this far, you’re probably serious about trying.
Here’s what I would tell myself if I were starting again.
Start small. Verify early. Avoid bonuses. Test withdrawals early.
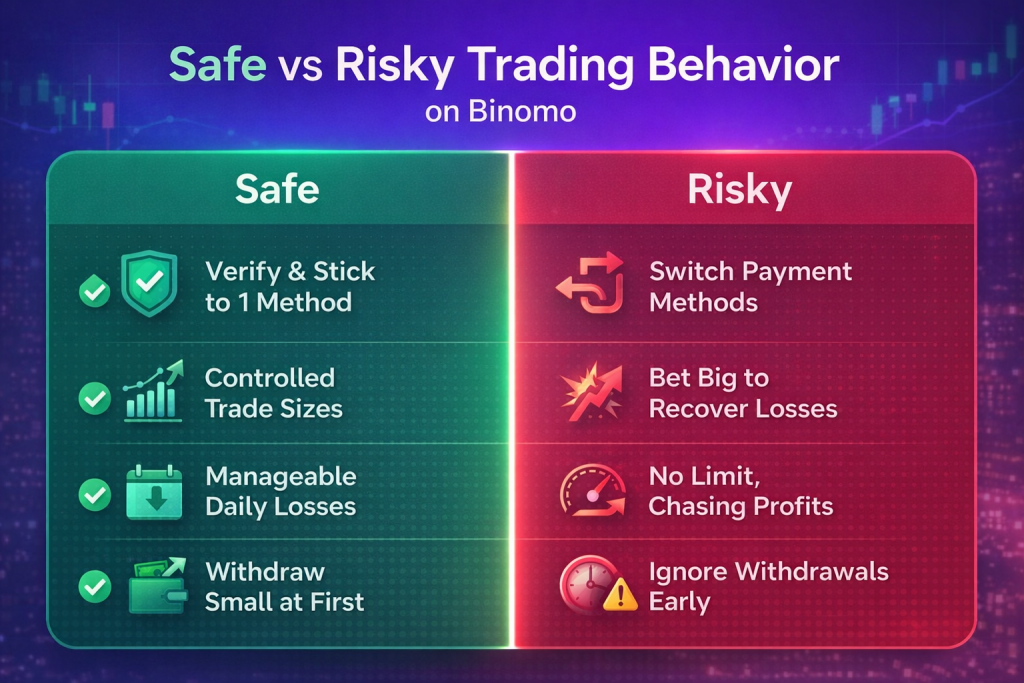
Here’s the most honest answer based on actual use.
It is safe if:
You verify your account properly
You use consistent payment methods
You control your trading behavior
It is risky if:
You chase quick profits
You ignore rules
You trade emotionally
That’s the nuance most reviews miss.
It’s not just about the platform.
It’s about how you use it.
What I’d Do If I Started Again
If I had to restart today, I wouldn’t try to make money first.
I would test the system.
Open account
Verify immediately
Deposit a small amount
Place a few trades
Request a withdrawal within 24 hours
Also, if you ever need to contact support, don’t just send random messages. I learned that detailed, structured communication gets faster responses. This guide helped me avoid copy-paste replies.
Once the full cycle works, then I would scale.
Final Thoughts From My Trading Notes
After months of using it, I don’t label Binomo as safe or risky in isolation anymore.
It’s conditional.
It gives you access. It gives you tools. It also exposes your weaknesses.
That’s where most people fail.
So instead of asking again “Is Binomo safe or risky in 2026?”, ask yourself:
Are you trading in a controlled way?
That question matters more than any review.
👉 If you’re ready to test it properly, create your account and start small here.
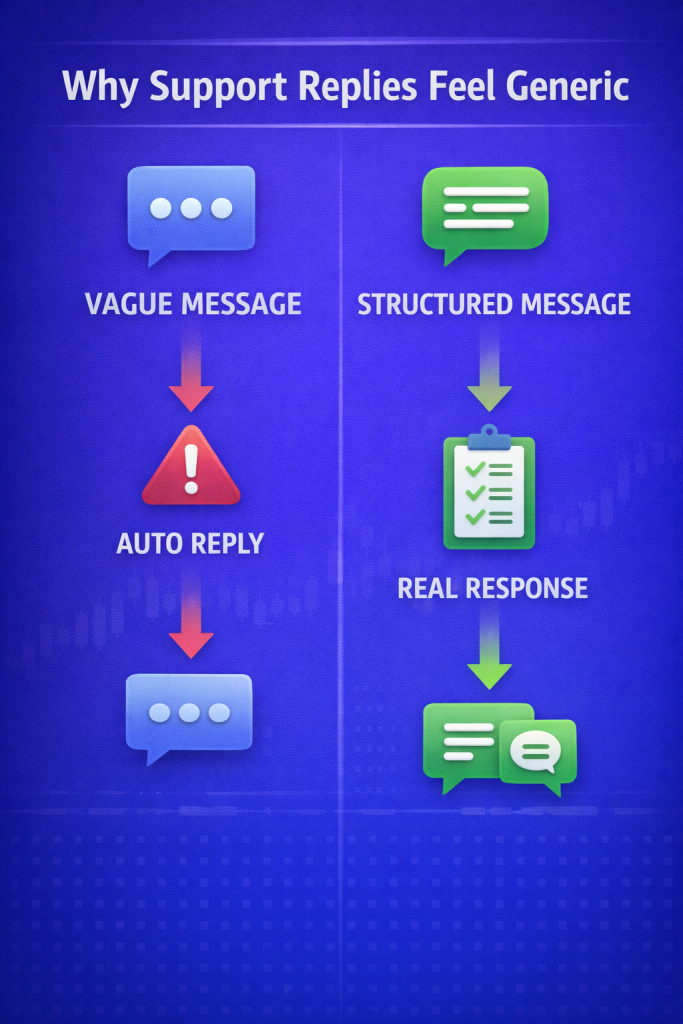
Binomo Support Contact Guide: What to Send So You Don’t Get Copy-Paste Replies
I didn’t take support seriously until my first withdrawal got stuck.
At that point, I had already made a few decent trades and felt confident. But when the money didn’t arrive, I rushed to support and sent a quick message. It felt clear to me, but the reply I received was generic and didn’t solve anything.
That experience forced me to rethink how I communicate. I stopped treating support like a complaint box and started treating it like part of my trading system.
This is my real, experience-based Binomo support contact guide that helped me move from copy-paste replies to actual solutions.
If you’re starting fresh, don’t repeat my early mistakes. Open your account here and follow a structured setup from day one.
My First Mistake: Sending Incomplete Messages
My first message looked like this:
“Hi, my withdrawal has not been received. Please check.”
It felt fine at the time. But looking back, it had nothing useful in it.
Here’s what was missing:
No account ID
No transaction details
No payment method
No screenshots
No clear timeline
Support had no choice but to respond with a template asking for more details. That alone delayed everything.
What Changed When I Fixed My Approach
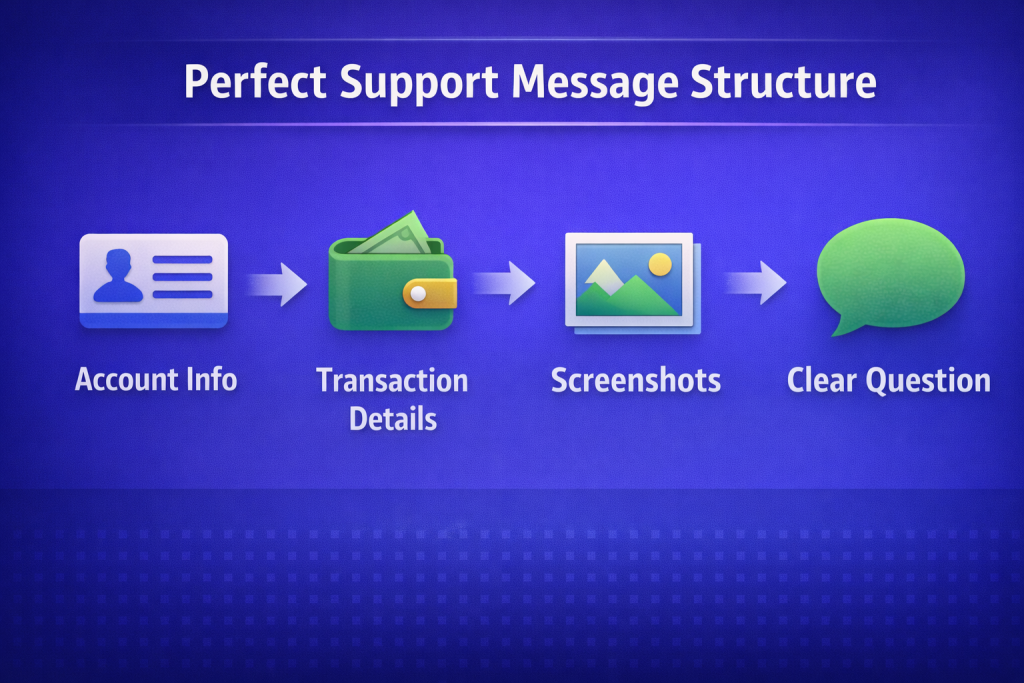
The next time, I approached it differently. I treated my message like a proper report.
Element
What I Sent
Why It Worked
Account Info
Registered email + account ID
Helps them locate your account instantly
Transaction Details
Amount, method, date
Removes guesswork
Screenshots
Wallet + transaction proof
Speeds up validation
Timeline
Exact timestamps
Shows clarity
Clear Question
One issue only
Avoids confusion
That single change transformed the response I received. It was no longer generic. It was specific to my case.
That’s when I realized this Binomo support contact guide approach actually works in real scenarios.
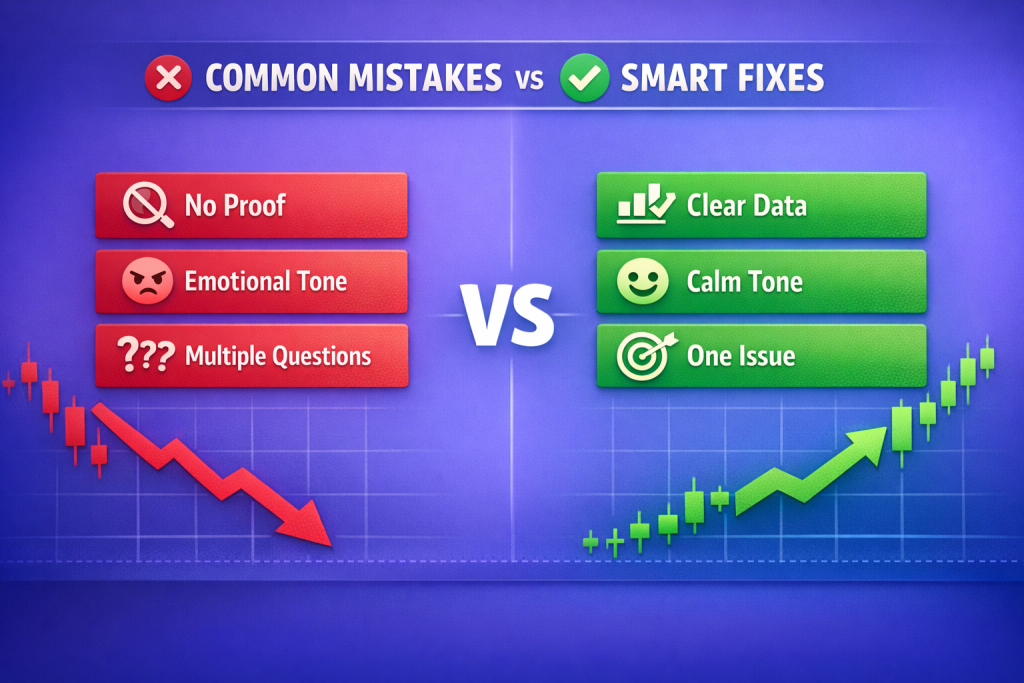
Why Most Traders Get Copy-Paste Replies
After a few interactions, I started seeing a pattern.
Support teams are not ignoring you. They are filtering incomplete messages.
If your message is unclear, it gets routed into a generic reply system. If it’s structured, it gets real attention.
Most traders unknowingly do this:
Send emotional or rushed messages
Ask multiple questions in one message
Skip proof or screenshots
Use vague wording
I’ve done all of these myself, especially in the beginning.
My Personal Message Template That Works
After testing different formats, I now use a simple structure that consistently gets better replies.
Subject: Withdrawal Delay – Account ID XXXXX
Message:
Hello, My account ID is XXXXX (registered email: [email protected]).
I requested a withdrawal of $XX on [date] using [payment method]. The transaction is still pending after [X days].
Attached are:
Transaction history screenshot
Payment method confirmation
Please confirm the current status and let me know if any verification is required.
Thank you.
This format is clean, direct, and hard to ignore.
Where Most Guides Fail (And What Actually Helped Me)
Most guides just say “contact support” without explaining how.
That’s where the real gap is.
For example, when my withdrawal was pending, I didn’t understand the timeline. Later, I found this breakdown extremely useful because it explains what happens at each stage.
Similarly, I made a critical mistake early on by using different deposit and withdrawal methods, which caused unnecessary delays. This explained exactly why that happens.
These are things support won’t explain in detail unless you ask the right way.
The KYC Factor I Ignored at First
One of my biggest delays came from verification issues.
I thought uploading any document would work. It didn’t.
Once I corrected these, my support interactions became much smoother.
Mid-Journey Realization: Support Is Part of Your Strategy
At some point, I stopped reacting to problems and started preventing them.
I aligned everything:
One payment method only
Clean KYC documents
Structured support communication
This reduced my dependency on support entirely.
If you’re trading from this region, choosing the right payment method matters more than most people realize. This breakdown helped me pick the right one.
If you want fewer issues and smoother withdrawals, start with the right setup and a verified account here.
The Hidden Trap: Bonus and Balance Confusion
Another issue I faced was related to bonuses.
At one point, I accepted a deposit bonus without fully understanding the terms. That complicated my withdrawal and required extra clarification with support.
If you’ve ever been confused about why your balance isn’t fully withdrawable, this explains it clearly.
These are small details, but they create big problems if ignored.
Final Thoughts: Treat Support Like a Trade Setup
Looking back, the biggest shift wasn’t in trading. It was in how I handled problems.
Once I started sending structured, evidence-based messages, support responses improved instantly.
This Binomo support contact guide is not about tricks. It’s about clarity.
If your message is clear, your results will be too.
If you’re serious about trading and want fewer delays, start with a clean setup, verified account, and disciplined workflow here.
When you treat support like part of your strategy, not an afterthought, most of the common frustrations simply stop happening.
Binomo Bonus Terms Explained: When a Deposit Bonus Can Delay or Block Your Withdrawal
The first time I accepted a bonus on Binomo, I thought I was making a smart move.
I had just made a small deposit, saw the extra balance appear, and immediately felt more confident. More funds meant more trades, more flexibility, and maybe faster progress. At least that’s how it looked on the screen. What I learned later is that Binomo bonus terms explained properly can save you from one of the most frustrating mistakes a new trader can make.
Before you accept any promotion, I’d strongly suggest opening your account with a “first withdrawal first” mindset, not a “bigger balance first” mindset. That single shift would have saved me time, confusion, and a lot of second-guessing.
Why I Stopped Seeing Deposit Bonuses as Free Money
My biggest mistake was simple. I treated the bonus like it was mine.
If I deposited $100 and Binomo added a 50% bonus, I mentally started trading as if I had $150 of fully usable money. Inside the platform, that was true. But when I started thinking about withdrawing, I realized the platform balance and the withdrawable balance were not always the same thing.
That was the moment Binomo bonus terms explained started to matter.
Here’s the basic reality I wish someone had shown me earlier:
What I Saw
What It Actually Meant
Bonus added instantly
Extra trading funds, not always instantly withdrawable
Higher total balance
Some part may be tied to conditions
Profits after bonus trades
Can still be affected by bonus rules
Withdrawal option available
Request may still be limited or delayed
This is where most beginner content online misses the point. People say “read the terms,” but they rarely explain which term actually matters.
The Real Catch: Turnover Rules
For me, the most important part of Binomo bonus terms explained was the turnover requirement.
That’s the condition that decides whether the bonus is just a trading boost or a future withdrawal problem.
In simple words, if you accept a deposit bonus, you may need to trade a certain volume before the bonus or related profits become fully eligible for withdrawal. That means your account can show a healthy balance, but your payout process may not be as clean as it would be without the bonus.
Let’s say I deposited $100 and got a $50 bonus. On paper, it looked great. But if the bonus came with a heavy trading volume condition, I was no longer dealing with a simple first deposit. I had entered a more complicated cycle.
That’s why I now tell people to compare this carefully with how a normal first real account behaves. If you’ve already read my breakdown of demo vs real account conditions after your first deposit, you’ll understand why I prefer a clean test over a boosted balance.
How a Deposit Bonus Can Delay or Block Your Withdrawal
This is where I had my biggest lesson.
When I first tried to withdraw after using bonus-linked funds, the process felt less straightforward than my earlier no-bonus tests on other platforms. Nothing dramatic happened, but it was enough to make me go back and check every condition I had ignored.
In practice, a bonus can create three problems:
Your withdrawal may be delayed while the system checks bonus eligibility
Your available payout may be lower than your displayed balance
Your request may be restricted until the bonus is canceled or turnover is completed
That does not automatically mean the platform is refusing to pay. Sometimes it simply means you accepted terms that changed how your funds are treated.
This is the part most search results and AI summaries oversimplify. They talk about “withdrawal issues” without explaining that the issue is often the bonus structure itself.
If your goal is a clean first payout, I’d rather you use the same cautious setup I use now. Open your account, keep the first deposit small, and focus on a test withdrawal before chasing bigger trade size.
My Safer First Deposit Rule on Binomo
After learning this the hard way, I changed my process completely.
Now my first-cycle routine is simple:
One payment method only
Small first deposit
No bonus on the first round
Light trading volume
First test withdrawal before scaling
That single adjustment removed most of the uncertainty.
If I want to explore bonuses later, I do it only after I’ve already confirmed the payment method, identity verification, and withdrawal flow are working smoothly. That’s the same logic behind my other guides on what actually changes after your first deposit and the payment methods that tend to work better in Pakistan.
When a Bonus Actually Makes Sense
I’m not against bonuses. I’m against accepting them blindly.
A deposit bonus can make sense if:
You are not planning to withdraw soon
You fully understand the turnover requirement
You are using it for trading flexibility, not fast cash-out
You can separate trading capital from withdrawable capital
That’s the honest version of Binomo bonus terms explained.
The question is not whether the bonus looks good. The real question is whether it fits your withdrawal plan.
Final Verdict: My Honest Take
If you ask me whether a beginner should accept a Binomo deposit bonus on their first real deposit, my answer is simple:
Usually no.
Your first priority should be proving that your payment method works, your verification is clean, and your first withdrawal goes through without unnecessary complications. Once you’ve completed one smooth payout, then you can test bonus offers with a clearer understanding of the risk.
That’s the lesson I learned from experience.
The bonus was never really free money. It was extra trading balance attached to extra rules. And if you ignore those rules, a normal withdrawal can suddenly feel blocked when it’s really just restricted by terms you agreed to too quickly.
If you’re opening a new account, start small, skip the bonus on round one, complete a test withdrawal, and only scale after that. If you want the safer path, use our recommended signup route and treat your first deposit like a verification step, not a profit sprint.
Binomo Demo vs Real Account: What Changes After You Deposit (KYC, Payout, Support, Limits)
I spent far too long thinking my Binomo demo results meant I was “ready.”
On demo, everything felt clean. My entries looked sharp. My timing looked better than it probably was. I could reset virtual balance, test ideas, and convince myself I had control. Then I made my first real deposit, and that’s when I realized the platform didn’t just switch from fake money to real money. The entire experience changed.
That’s the part most articles skip.
Most search results explain what a demo account is, what a real account is, and how to switch between them. That’s basic stuff. What they usually do not explain well is what actually changes after you deposit: how KYC suddenly matters, how payout behavior becomes something you have to respect, how support feels different when real money is involved, and how small account limits can quietly trap beginners.
That’s what I want to document here, from the perspective of someone who treated the demo like training and the real account like a reality check.
If you want to test the platform the same way I did, start small and keep the first deposit boring, not emotional: open a Binomo account here and use the demo first before risking real funds.
My Short Version: Demo Taught Me Mechanics, Real Money Taught Me Friction
The fastest way I can explain Binomo Demo vs Real Account is this:
The demo account teaches you buttons, chart rhythm, and trade timing
The real account teaches you discipline, verification, withdrawal rules, and emotional control
That sounds obvious, but the gap is bigger than it looks.
On demo, I was only managing trade decisions. On real, I had to manage:
My deposit method
My identity documents
My future withdrawal route
My risk per trade
My expectations from support
My account status and limitations
That’s why I no longer treat demo and real as “same platform, different balance.” They are connected, but they behave like two different stages of the same journey.
The Day I Switched From Demo to Real, My Trading Style Changed Instantly
I remember the first time I deposited. It wasn’t a huge amount. I deliberately kept it small because I didn’t want the first week to become a stress test.
Before the deposit, I was placing demo trades almost casually. I could take a loss and move on because it meant nothing. I could overtrade because there was no cost. I could hold onto bad habits because the account never punished me in a meaningful way.
The moment real money hit the balance, I hesitated.
I noticed something immediately: my “good setup” on demo suddenly felt less certain on real.
Not because the chart changed, but because I changed.
That’s the first major difference in Binomo Demo vs Real Account that top search results rarely explain honestly:
The biggest change is psychological, not technical.
On demo:
I clicked fast
I tolerated weak setups
I doubled activity after a loss
On real:
I second-guessed entries
I exited my routine
I wanted to recover losses too quickly
I became overly aware of every small candle
That’s why I now think demo is useful for practice, but dangerous if you mistake it for proof.
What Actually Stays the Same Between Demo and Real
To be fair, not everything changes.
The platform layout, asset browsing, basic chart behavior, and order placement flow feel familiar. That part matters because the demo is still a good sandbox for learning the interface.
Here’s the clean comparison:
Feature
Demo Account
Real Account
Platform interface
Same/similar
Same/similar
Trade placement mechanics
Same/similar
Same/similar
Chart familiarity
Same/similar
Same/similar
Emotional pressure
Very low
Very high
KYC relevance
Not urgent
Critical before/at withdrawal
Withdrawal access
None
Yes, if verified
Deposit method consequences
None
Very important
Support urgency
Low
Much more important
Account limits matter
Barely
A lot
Mistakes cost money
No
Yes
This is why I still tell beginners to use demo first, but only for mechanics, not for confidence inflation.
The First Real Shock: KYC Suddenly Becomes Part of the Trading Experience
When I was on demo, KYC felt like background noise.
I knew it existed. I knew people talked about it. But it didn’t affect me because I wasn’t trying to withdraw anything.
That changed the moment I started planning my first payout.
This is one of the biggest content gaps I keep seeing around Binomo Demo vs Real Account: many guides talk about “you may need verification,” but they don’t explain how much this changes your behavior once real money is on the line.
When I deposited, I started asking different questions:
Is my account name consistent?
Is my payment method in my own name?
Will my first withdrawal trigger document checks?
Did I use the same route I’ll later need to withdraw through?
Those questions don’t exist in demo.
In real trading, they matter before your first profitable day, not after it.
My rule now is simple: I assume the first withdrawal is part of account setup, not a bonus event.
That mindset alone saved me from a lot of beginner frustration.
If you want the exact rejection patterns beginners run into, the best companion read is my breakdown of the KYC documents that usually trigger rejection on first withdrawal.
The Mistake I’m Glad I Didn’t Make: Mixing Payment Methods
On demo, there is no payment trail. No consequences. No memory.
On real, your deposit method becomes part of your future withdrawal story.
This is where a lot of people get caught off guard. They think the deposit is the easy part, so they use whatever method works in the moment. Then later they wonder why withdrawal becomes messy, delayed, or confusing.
I learned early that the “fastest deposit option” is not always the “safest first account setup.”
For my first real account phase, I stuck to one method. I wanted the funding path to stay clean. That made it easier to keep my records simple and avoid creating unnecessary questions later.
If you’re in Pakistan or nearby markets, this matters even more because method availability can shift. I’d strongly recommend reading which payment methods are actually working in Pakistan, India, and Bangladesh right now before you fund anything.
And if you want the specific reason I avoid mixing wallets/cards on early deposits, read why using different payment methods can create withdrawal delays later.
Payout Reality: Demo Wins Feel Instant, Real Wins Feel Conditional
This was probably the biggest emotional shift for me.
On demo, a winning trade just increases a number on the screen. That’s it. It feels clean and immediate.
On real, a winning trade is only the first half of the process.
The second half is what people underestimate:
Can I preserve the balance?
Can I avoid revenge trading?
Can I request withdrawal cleanly?
Can I pass any required checks?
Can I wait without panicking?
That’s the real difference.
In demo, profit is a number. In real, profit is only real after it survives your own behavior and gets withdrawn.
That’s why my first real goal was never “double the account.” It was much simpler:
Deposit small → trade lightly → request first test withdrawal → confirm payout flow
That one sequence taught me more than dozens of demo sessions.
If you’re already stuck in the waiting phase, I’d pair this article with my hour-by-hour guide to Binomo withdrawal pending reasons and what to do at each stage.
Support Feels Very Different When You Have Real Money Involved
This is another point most generic articles barely touch.
When I was using demo, support was basically irrelevant to me. I didn’t need help because there was no real consequence if something felt confusing.
Once I deposited, support stopped being a “nice feature” and became part of my risk management.
I started paying attention to things like:
How clear the cashier status messages were
Whether document feedback was specific or vague
How quickly I could get an answer when something was pending
Whether I had screenshots and timestamps ready
That last part matters a lot.
The real-account mindset is not just “contact support if there’s a problem.” It’s: document your own activity before there’s a problem.
Now whenever I’m dealing with a real-money issue, I keep:
Deposit timestamp
Payment method used
Screenshot of successful funding
Withdrawal request time
Any status change message
Support chat or email trail
This makes support conversations shorter and cleaner.
On demo, none of that matters. On real, it can save days of confusion.
Limits: The Trap That Beginners Usually Notice Too Late
If I had to pick one hidden beginner trap in Binomo Demo vs Real Account, it would be this:
The real account has practical limits that change how small balances behave.
On demo, you can practice endlessly. You don’t care about minimum deposit logic, minimum withdrawal thresholds, or whether your account size is even large enough to test a clean cashout cycle.
On real, these limits shape your decisions.
This is where beginners get stuck:
They deposit the minimum
They take a few losses
They make a few tiny wins
Then they realize the remaining balance is awkward for meaningful recovery
Or they discover the withdrawal threshold changes how useful that small balance really is
That’s why I stopped asking, “What’s the minimum deposit?” and started asking, “What’s the minimum practical amount to complete a full test cycle?”
My Personal Real-Account Workflow (What I’d Repeat Today)
After making mistakes on demo and learning the hard way on real, this is the exact workflow I’d repeat if I were starting from zero again:
Phase 1: Use Demo for Platform Familiarity Only
I’d use demo to learn:
How expiry timing feels
How to avoid random clicking
How to wait for only a few setups
How my strategy behaves across sessions
But I would not use demo results as proof that I’m profitable.
Phase 2: Make a Small, Single-Method First Deposit
I’d keep the first deposit small enough that a total loss wouldn’t damage my judgment.
More importantly, I’d use one clean payment method that I can later track.
Phase 3: Trade Lightly, Not Heroically
I would not try to “make the deposit worth it” on day one.
That’s where most damage happens.
My first real sessions were best when I:
Took fewer trades
Accepted smaller wins
Stopped after emotional spikes
Avoided recovery trades
Phase 4: Aim for a Test Withdrawal Early
This changed my thinking completely.
Instead of chasing account growth first, I now chase payout confirmation first.
That tells me more about the real account than a lucky win streak ever could.
If you want to do it the safer way I did later, start with a small test cycle, not a big ambition: open a Binomo account here, fund it conservatively, and treat your first withdrawal like part of setup.
What Most Google Results and AI Summaries Miss About Binomo Demo vs Real Account
After reading a lot of generic results and seeing the same recycled summaries, I think the biggest content gap is this:
Most articles reduce Binomo Demo vs Real Account to a surface-level comparison.
They usually say:
Demo = practice
Real = actual money
Demo = no risk
Real = risk
That’s true, but incomplete.
What they often miss is that the real account introduces operational friction:
Verification becomes relevant
Deposit method choice affects future withdrawals
Support quality suddenly matters
Small limits can distort your early strategy
Emotions can destroy a setup that looked “proven” on demo
A profitable trade is not the same as a successful payout
That last line is the one I wish I understood earlier.
A profitable trade is not the same as a successful payout.
Once I accepted that, I stopped trading like a demo user with a real balance.
My Honest Verdict: Demo Is for Skill Reps, Real Is for Process Validation
If someone asks me today whether demo and real are “basically the same,” my answer is no.
They share the same screen. They do not create the same trader.
My honest verdict on Binomo Demo vs Real Account:
Use demo to learn the interface, timing, and how your strategy behaves without pressure
Use real to test whether your process holds up when money, KYC, withdrawals, and discipline enter the picture
If I could summarize my own journey in one sentence, it would be this:
The demo account taught me how to place trades. The real account taught me how not to ruin a trading account.
That’s a much more valuable lesson.
Final Thoughts From My Own Trading Notes
When I look back, I don’t regret using the demo account. It helped me avoid stupid platform mistakes.
What I do regret is believing demo confidence was the same thing as real readiness.
Real readiness is different.
Real readiness means:
Your account details are clean
Your payment method is consistent
Your expectations are realistic
Your first deposit is small enough to stay calm
Your first withdrawal is planned, not improvised
Your support trail is documented
Your goal is survival and clean execution, not excitement
That’s the difference I wish someone had explained to me earlier.
If you want to approach it the same way I’d do it now, keep the first step simple: open your Binomo account here, start on demo, then move to a small real deposit only when you’re ready to test the full payout process.
Binomo Minimum Deposit vs Minimum Withdrawal: The Real Trap Beginners Miss
I almost fell for the simplest trap on Binomo.
Not a bad entry. Not a losing strategy. Not even a bad signal.
It was the gap between the Binomo minimum deposit vs minimum withdrawal that quietly changes how beginners behave.
When I first opened a real account, the low entry point looked harmless. That’s exactly why it worked so well on me. I saw the small starting amount, assumed everything else would be equally flexible, and treated my first deposit like a casual test. What I didn’t understand at the time was this: a platform can make entry feel frictionless while making exit feel conditional, slower, or psychologically harder.
That mismatch is where most beginners lose control.
If you’re still at the “should I test this with a small amount?” stage, open your account only if you’re willing to treat your first deposit like a payout test, not a profit chase. Use my recommended signup here: Open a Binomo account and start with a controlled test amount.
I’m writing this the way I wish someone had explained it to me early: not as a hype post, not as a “Binomo is easy money” pitch, but as a real trading note from someone who learned the expensive lesson that deposit rules and withdrawal reality are not the same thing.
The beginner assumption that caused my first mistake
My thinking was simple:
Minimum deposit looked small
Minimum trade looked small
So withdrawal should be equally simple
That was the mental trap.
On the surface, Binomo looks beginner-friendly because the entry barrier feels low. You can start with a small deposit, place small trades, and it all feels manageable. That’s what pulled me in at first. I thought I was being careful because I wasn’t risking much.
But the problem wasn’t the small deposit.
The problem was that I built my entire expectation around the deposit side and barely thought about the withdrawal side.
That’s the content gap most articles miss.
They tell you:
“Binomo minimum deposit is low”
“You can start small”
“Withdrawals are available”
But they rarely explain the behavioral trap:
A low minimum deposit encourages under-planned first deposits, but a higher-friction withdrawal process punishes under-planned first deposits.
That’s the real story behind Binomo minimum deposit vs minimum withdrawal.
What most articles miss about Binomo minimum deposit vs minimum withdrawal
After looking at how most pages talk about this topic, I noticed the same pattern.
Almost everyone focuses on the entry number.
They talk about how little you can start with, how easy it is to fund an account, and how accessible it feels for beginners. But that’s only half the story, and honestly, it’s the less important half.
The real issue is what happens after the deposit.
The real problem is not the amount, it’s the cashflow structure
A beginner sees a small deposit and assumes they can move money in and out casually.
That assumption is dangerous.
Because the first withdrawal is where things suddenly become more serious:
KYC readiness
whether your payment method matches your deposit route
whether the method is in your own name
whether your documents are clean
whether your provider is supported for payouts
So the true “minimum” isn’t just a number.
It’s the smallest amount you can deposit and still cleanly complete a test withdrawal.
A “small deposit” can still be a bad test
This was one of the biggest lessons for me.
I used to think a tiny deposit automatically meant lower risk.
Not always.
If your deposit is so small that a few losses push your balance below a practical withdrawal threshold, then you didn’t actually create a proper test. You just created a fragile account that’s now harder to evaluate.
That’s why a minimum deposit can be technically valid but strategically useless.
Beginners confuse platform minimum with payment method minimum
This is where a lot of people get blindsided.
The platform may advertise one minimum, but your actual payment route can have its own behavior, limitations, timing, or verification expectations.
That’s especially relevant in countries like Pakistan, where local payment methods can feel smooth on the deposit side but create confusion on the withdrawal side if you haven’t tested them properly.
That distinction matters far more than most “minimum deposit” articles admit.
My first real lesson: the platform made it easy to deposit, but not “casual” to withdraw
The first time I funded a Binomo account, I wasn’t trying to be reckless.
I was actually trying to be smart.
I deposited a small amount, thinking I’d:
place a few trades,
see how the interface feels,
maybe win a little,
then withdraw just to confirm everything works.
That sounds responsible. But I made three rookie errors.
Error 1: I treated the first deposit like trading capital instead of a payout test
This was the biggest mistake.
I used most of the balance for actual trades before testing the withdrawal pipeline.
So instead of proving:
deposit works
KYC is accepted
payment method is payout-compatible
funds land back smoothly
…I was busy trying to grow the balance first.
That’s backwards.
Error 2: I didn’t think about same-method withdrawal logic
This sounds obvious after the fact, but beginners miss it all the time.
A payment method that works for deposit is not automatically a payment method that feels simple for withdrawal.
That’s why I now assume the opposite until proven otherwise.
If I deposit using one method, I expect the cleanest early path is to stay consistent and avoid creating unnecessary confusion with multiple methods before the first payout is tested.
Error 3: I assumed minimum withdrawal meant “easy withdrawal”
This is the subtle one.
Even if the nominal minimum withdrawal looks small, that does not mean your first small withdrawal will feel easy in practice.
Why?
Because the real gate is often not the number. It’s the process.
That’s the trap behind Binomo minimum deposit vs minimum withdrawal that beginners miss.
Binomo minimum deposit vs minimum withdrawal: the simple comparison beginners actually need
Here’s the clean version I wish I had on day one:
Factor
What beginners see first
What actually matters
Minimum deposit
A low entry point that feels easy and safe
The visible entry price is designed to feel low and simple
Minimum trade
Small trade size creates confidence
Encourages “I can just test casually” behavior
Minimum withdrawal
A small number that sounds flexible
Your payout method, KYC status, and provider rules matter more than the raw number
First payout speed
People expect quick access to funds
Delays, checks, and provider behavior matter more than expectations
Real beginner risk
“Can I start with a small amount?”
“Can I complete a clean first withdrawal without friction?”
That last line is the whole article in one sentence.
The real question is not:
“What’s the minimum I can deposit?”
It’s:
“What’s the minimum I can deposit while still safely proving my withdrawal path?”
That’s the real Binomo minimum deposit vs minimum withdrawal lens.
The safer first-deposit rule I use now
After a few rounds of trial, I changed my workflow completely.
I no longer treat the first deposit as a trading opportunity.
I treat it as a cashier test.
My personal rule now:
Use one deposit method only
Verify identity early
Keep the first deposit small but not reckless
Make only light trades
Attempt a small withdrawal before scaling anything
That change alone saved me from repeating the same beginner loop.
If you want to copy the safer workflow I use now, open your account only when you’re ready to do a first deposit + first withdrawal test, not a profit sprint: Create your Binomo account here.
This matters even more if you’re using local or region-specific payment methods.
Your Binomo minimum deposit vs minimum withdrawal experience can feel completely different from someone else’s, even when the platform headline numbers look the same.
What I now tell beginners in Pakistan specifically
If you’re reading this from Pakistan, the biggest mistake is assuming a payment method that deposits easily will also withdraw smoothly under the same conditions.
That assumption is dangerous.
What I’d do now:
Keep the first cycle boring
Your first cycle should be:
register
verify
deposit with one method
place only a few small trades
request a test withdrawal
Not:
register
deposit fast
chase 5–10 trades
top up again
only think about withdrawal later
That second path is how people get emotionally trapped.
Don’t mix methods too early
If you deposit via one method, stay consistent early. Mixed funding often creates confusion when it’s time to prove ownership, reconcile transaction history, or match payout expectations.
Don’t let a low minimum trick you into underfunding your test
A minimum deposit is not always a practical deposit.
If the amount is so small that a few losses drop you below a usable test balance, then you didn’t “start safe.” You just started fragile.
That’s the nuance most Binomo minimum deposit vs minimum withdrawal articles never explain.
The psychological trap is bigger than the technical one
This is the part nobody talks about enough.
When the deposit is small, beginners become less disciplined, not more.
I’ve seen it in myself.
A tiny deposit creates the illusion that mistakes are cheap.
But that mindset often causes:
faster entries
more impulsive trades
less planning
no withdrawal test
a second deposit before the first payout is proven
That second deposit is where the real damage starts.
Because once you’ve deposited twice without proving a withdrawal, you’re no longer testing. You’re committing.
That’s why my private rule is simple:
No second meaningful deposit until first payout proof.
It sounds boring. It’s also the most useful rule I’ve ever used on platforms like this.
Related reads on my site that pair naturally with this topic
To keep readers moving naturally through the topic, I’d place internal links like this inside the article:
Binomo in Pakistan / India / Bangladesh: What Payment Methods Actually Work in 2026?
When I first started testing Binomo seriously across South Asia, I made one rule for myself: I would never judge a platform by the deposit button. I would judge it by the withdrawal result.
That single rule saved me a lot of frustration.
A lot of articles still ranking for this topic say the same thing: Visa, Mastercard, Skrill, Neteller, crypto, bank transfer. On paper, that sounds helpful. In reality, if you live in Pakistan, India, or Bangladesh in 2026, it’s not enough. What matters is not the generic list. What matters is what actually appears in your cashier, what gets accepted cleanly, and what still works when it’s time to withdraw.
That is the content gap most search results miss.
So instead of repeating the usual “available payment methods” checklist, I want to share this the same way I keep my own trading notes: based on small deposits, real caution, failed assumptions, and the simple habit of testing the payout path before I ever scale.
If you want to test the same way I do, start small and verify early. You can open a small Binomo test account here and treat your first deposit like a payment-method test, not a trading challenge.
My real 2026 takeaway before the details
If I had to summarize my 2026 experience in one paragraph, it would be this:
In Pakistan, local wallet-style funding usually feels the most practical, especially Easypaisa, JazzCash, and bank-transfer-style routes when they appear in the cashier. In India, UPI-style funding is usually the easiest to spot, but “easy deposit” and “safe long-term workflow” are not the same thing. In Bangladesh, the answer is much less consistent, and that’s exactly why so many articles on this topic are misleading. Availability often feels more account-dependent there, so I never assume a method works just because an old guide says it does.
That last point matters more than people think.
Why most “Binomo payment methods” articles are incomplete in 2026
The problem with most articles is simple: they describe payment categories, not real user behavior.
They’ll say:
bank card
e-wallet
bank transfer
crypto
Technically, that’s not wrong. But it’s too broad to help a real trader in South Asia.
When I’m testing Binomo in Pakistan / India / Bangladesh, I use a much stricter filter. A payment method is only “working” if:
It appears in my cashier for my country
It can be verified cleanly if asked
It gives me a realistic withdrawal path
It doesn’t force me into a messy workaround later
That’s the standard I use below.
What actually worked for me on Binomo in Pakistan in 2026
Pakistan is one of the few places where the practical answer feels clearer than the generic search results.
From my own testing and from what typically appears for Pakistan-facing users, the most realistic starting points are:
Easypaisa
JazzCash
Bank transfer
Sometimes local payment processors like Cashmaal
Crypto as a backup, not a first choice
Easypaisa and JazzCash: best for a small first deposit
If I’m opening fresh in Pakistan, I usually prefer starting with a local wallet-style method over a random card.
Why?
Because the deposit side tends to feel smoother, and for a small first test, the process is usually easier to control.
That said, I never confuse “deposit went through” with “method is safe.” I still check:
whether the transaction shows cleanly in history
whether the account name matches
whether the platform later asks for payment-source proof
For a first live test, Easypaisa and JazzCash feel like the most realistic starting points.
Bank transfer: less exciting, but often cleaner for serious money
This is where a lot of traders get it wrong.
They focus on the fastest deposit method, then later realize the cleanest withdrawal route was the boring option they ignored.
In my own experience, if bank transfer appears clearly and the account is already verified, it usually feels more stable for a “serious money” workflow than an impulsive wallet-first approach. It may not feel as fast, but I care more about clean payout logic than flashy deposit speed.
Crypto: workable, but only if you’re disciplined
Crypto is the method a lot of beginners rush into because it looks universal.
It isn’t.
It can work, but it adds extra ways to make avoidable mistakes:
wrong network
poor recordkeeping
KYC mismatch later
panic when asked for payment-source evidence
I only treat crypto as a secondary route, never my first one, unless I’ve already completed a successful small withdrawal on the account.
My Pakistan ranking in 2026
Payment Method
My 2026 Verdict
Best Use Case
Main Risk
Easypaisa
Best starter option
Small first deposit
Can still trigger payment-source checks later
JazzCash
Best starter option
Small first deposit
Same risk if you skip verification
Bank transfer
Best “serious money” route
Larger, cleaner funding/withdrawal path
Slower than wallet methods
Cashmaal
Conditional
If it appears and you know the flow
Less universal than wallet/bank routes
Crypto
Advanced only
Backup funding route
Network and proof issues
What actually worked for me on Binomo in India in 2026
India is where I need to be more careful, because this is the market where people confuse “it lets me deposit” with “this is a safe operating setup.”
That is not the same thing.
From what I’ve seen in 2026, UPI-style funding still tends to be the most visible or accessible route for many Indian users. But if I’m being completely honest, I do not automatically treat that as the best method just because it’s convenient.
UPI-style funding: easiest deposit, not always my favorite method
UPI-style methods feel frictionless. That’s exactly why so many traders trust them too early.
The first deposit may look clean. The payment may reflect fast. It may feel local and simple.
But I’ve learned to ask a different question:
What happens when I want my money back?
That’s where a lot of the “Binomo India payment method” advice online becomes too shallow.
In India, I care more about:
whether the payment trail is clean
whether the payout route is obvious
whether I’m relying too heavily on a method that feels convenient but becomes fragile later
So yes, if UPI appears, it may be the easiest way to test with a tiny amount. But “easiest” is not the same as “best.”
Bank-transfer-style payout logic: often more practical than people expect
One lesson I learned quickly is that many traders assume a card or UPI-style deposit automatically means they’ll withdraw the same way without issues.
That assumption causes problems.
In practice, if a bank-transfer-style withdrawal path is visible and supported, I usually prefer that for a cleaner long-term workflow over blindly trusting the fastest deposit option.
Crypto in India: backup only
If I were writing a hype piece, I’d say crypto solves everything.
It doesn’t.
Crypto often becomes the emotional fallback after someone gets nervous about UPI or card behavior, and that is usually when mistakes happen.
If I use it at all, it’s only after:
KYC is already done
I understand the network
I’m not improvising
I’m using it as a backup, not as a panic move
My India ranking in 2026
Payment Method
My 2026 Verdict
Best Use Case
Main Risk
UPI-style route
Most accessible deposit
Tiny first test only
Too easy to overtrust
Bank transfer (if visible)
Better payout logic
Controlled withdrawal path
May not always appear
Bank card
Weak choice unless clearly supported
Only if fully visible and personalized
Wrong withdrawal assumptions
Crypto
Backup only
Last-resort flexibility
Adds complexity, not simplicity
If you still want to test carefully, the only approach I recommend is this: open a small account here, verify before you trade, and never scale before your first successful payout. That one habit alone filters out most avoidable payment mistakes.
What actually worked for me on Binomo in Bangladesh in 2026
Bangladesh is where the public information is weakest, and that’s why so many search results feel unreliable.
A lot of articles pretend there’s a neat, stable local list of payment methods.
That has not been my experience.
My Bangladesh rule in 2026
For Bangladesh, I never assume a method works unless it is:
visible in the cashier
usable on both deposit and withdrawal side
supported by a clean name match
proven by a small successful round-trip test
That may sound stricter than what most guides say, but it’s the rule that keeps the account clean.
What tends to be realistic in practice
From what I’ve seen, the realistic options often fall into some mix of:
international card, if enabled
bank-transfer-style routing, if shown
crypto
sometimes agent-like or local intermediary flows
The mistake many Bangladesh traders make is copying screenshots or advice meant for India or Pakistan. The cashier can differ. The payment flow can differ. The verification expectations can differ.
That is exactly why I don’t treat Bangladesh like a copy-paste market.
My Bangladesh ranking in 2026
Payment Method
My 2026 Verdict
Best Use Case
Main Risk
Card (if visible)
Decent starter if personalized
Small first test
Card verification mismatch
Bank-style transfer (if visible)
Better for larger withdrawals
Controlled payout path
Availability varies
Crypto
Often the fallback
Backup only
Too easy to misuse
Payment-agent style route
Situational
Only if clearly supported
Highest confusion risk
The payment method I stopped using first
If you’ve followed my other Binomo notes, you already know I don’t like “convenient but fragile” setups.
For Binomo in Pakistan / India / Bangladesh, the payment method I stopped trusting first was simple:
random card-first funding on an unverified account
That one move creates a surprising number of problems:
non-personalized card mismatch
unsupported withdrawal assumptions
payment-method verification delays
unnecessary panic while the account is still tiny
If I’m serious, I do this instead:
Open the account
Complete KYC early
Deposit with one method only
Reuse the same method if needed
Test a small withdrawal before scaling
That may sound boring, but boring is what survives withdrawals.
Final verdict: what payment methods actually work in 2026?
If I had to give the cleanest answer possible for Binomo in Pakistan / India / Bangladesh, here’s my honest conclusion.
In Pakistan, local wallet-style routes like Easypaisa and JazzCash usually feel like the most realistic starting point for a small test. If I want a cleaner long-term workflow, I lean toward bank transfer when it’s available.
In India, UPI-style methods may look like the easiest path, but I never treat convenience as proof of safety. I would only use it for a tiny first test, then judge the setup by whether the payout logic still makes sense afterward.
In Bangladesh, the only serious answer is this: use only what actually appears in your cashier, verify early, and judge the method by a completed withdrawal, not by a successful deposit.
That’s the real 2026 answer.
Not the pretty one. The useful one.
If you want to test Binomo the disciplined way, open a small account here, verify before you trade, and do not scale until your first payout lands. That single habit can save you from most avoidable payment mistakes.
Binomo Verification (KYC) for First Withdrawal: Exact Documents That Usually Trigger Rejection
The first time I tried to withdraw from Binomo, I was not worried about the trade.
I was worried about the paperwork.
That probably sounds strange if you are new. Most traders obsess over entries, expiry times, payout percentages, and strategy screenshots. I did too. But the moment I clicked my first withdrawal request, the game changed. Suddenly, it was no longer about whether I could make money on the platform. It was about whether I could prove I was the same person who made the deposit.
That is where most of the top Google results fail.
They tell you Binomo verification is “simple,” “fast,” or “usually takes 10 minutes.” But that is only the clean version of the story. What those pages do not explain well is which exact documents usually trigger rejection, why “valid” documents still fail, and why the first withdrawal feels easy right until KYC starts.
If you are still in the setup phase, my advice is simple: open small, fund with one method only, and prepare for the first payout before you scale. That one decision saved me from a much bigger mess later.
If you want to test Binomo the same way I did, start with a small account using my recommended registration link and treat your first withdrawal like a live systems check, not a victory lap.
Why Binomo KYC Feels Easy Until You Try Your First Withdrawal
My first few trades on Binomo were small. I was not trying to double an account in one night. I was documenting execution quality, checking slippage, and seeing whether short sessions on major forex pairs actually matched what the platform advertised.
I made a small deposit with one method only.
That part matters.
A lot.
Then I built the balance modestly, requested a test withdrawal, and only then did the verification flow become real.
This is one of the biggest content gaps in search results: people think Binomo verification happens when you sign up. In reality, the verification prompt often appears when you request a withdrawal. That means a trader can deposit, trade, and feel “fine” right up until the first payout request gets blocked behind KYC.
That is why I now treat Binomo verification (KYC) for first withdrawal as part of my funding workflow, not as an afterthought.
My First Withdrawal Attempt: What Triggered the Review
My first withdrawal was intentionally small.
Not because I did not trust my trading.
Because I did not trust the process yet.
I had already learned from other brokers that the first payout is the real test. A profitable balance on screen means nothing until the funds land back in your wallet or bank.
Here is what happened in my case:
Step
What I Did
What Happened
Deposit
Used one payment method only
Smooth
Trading
Kept position sizes small and realistic
No issue
First withdrawal
Requested a test amount
Verification prompt triggered
Identity upload
Submitted ID
Pending
Payment method upload
Submitted card proof
First rejection
Resubmission
Corrected the document format
Approved
The problem was not my identity document.
The problem was the payment method proof.
That is another thing the top search results often miss. Traders spend too much time worrying about passports and national IDs, but on Binomo verification (KYC) for first withdrawal, the payment method document is often where the rejection loop begins.
The Exact Documents That Usually Trigger Rejection on Binomo
Let me be blunt: most document rejections are not about fraud. They are about formatting, visibility, mismatch, or using the wrong type of proof for the method you deposited with.
A lot of traders assume that if a document is real, it will be accepted.
That is not how it works.
These are the documents that usually trigger rejection first.
1) Cropped or partially hidden national ID cards
This is the classic mistake.
My first ID upload looked clear to me. But I had cropped it tightly to “help” the system focus on the details. Bad idea.
Platforms often want:
All four corners visible
No glare
No fingers covering edges
Full document frame visible
Text readable at full zoom
If your national ID is front-and-back, upload both sides if requested. A lot of traders assume the front is enough because it shows the photo. Sometimes it is not.
What I learned: clear is not enough if the document looks edited or cropped.
2) Expired or near-expiry IDs
This one catches more traders than people admit.
Even if an ID is technically still active, a document that is too close to expiry can create friction.
If your ID is close to expiry, do not gamble on it. Use a passport or a fresher document if you have one.
3) Non-personalized bank cards with no visible name
This was the exact issue that nearly trapped my first withdrawal.
A lot of modern cards, especially virtual cards, prepaid cards, and some fintech-issued cards, either do not show your name clearly or do not show it at all.
This is where people get rejected because they upload:
Just the card photo
A screenshot from a banking app with no account ownership shown
A transaction list with no visible full name
A statement where the masked card number does not match the deposit card
This is probably the most underexplained issue in search results.
4) Virtual card screenshots with missing ownership proof
If you deposited using a virtual card, do not assume the screenshot of the card image inside the app is enough.
In many cases, the platform wants:
First 6 and last 4 digits visible
Expiry date visible
Cardholder name visible
Or a supporting document that connects the card/account to your name if the name is not on the virtual card view
That last part is where traders get stuck.
The screenshot may look perfect, but if it does not prove the card belongs to you, it can still fail.
5) Bank statements that are “real” but still unusable
This one is brutal because it feels unfair.
You can upload a genuine bank statement and still get rejected if:
It does not show your full name
It does not show enough of the card/account number to match the deposit method
It is too old
It is a screenshot instead of an official PDF or scan
It hides the exact transaction relationship they need to see
I have seen this issue on other platforms too, and it is not unique to Binomo. The “document is real” standard is not the same as the “document proves ownership in the exact format compliance wants” standard.
That is the real lesson.
The Simple Pre-Check I Use Now Before Every First Withdrawal
After that first rejection, I built myself a boring little checklist.
It is boring.
It works.
Document Type
What I Check Before Uploading
Common Rejection Trigger
ID card / passport
All corners visible, no glare, readable text, not cropped
Tight crop, blur, reflections
Driver’s licence
Front/back if needed, current validity, matching name
Only one side uploaded
Bank card
First 6 + last 4 visible, middle digits covered, name visible
Name hidden or card not readable
Virtual card screenshot
Card details + ownership link in same evidence set
No proof the card belongs to me
Bank statement
Full name, recent date, matching masked number, official format
Screenshot or missing match fields
That checklist reduced my resubmissions massively.
And if you are serious about Binomo verification (KYC) for first withdrawal, this matters more than any “secret strategy” video.
If you plan to trade on Binomo, open the account with one clean payment method from day one and save your deposit proof immediately. It makes the first withdrawal much easier later.
What Most Google Results and AI Answers Still Miss
This is the part I wish someone had told me earlier.
Most articles online still frame KYC as a yes/no event:
“You upload documents. They approve. You withdraw.”
That is not how it feels in the real world.
The real process is usually:
You deposit normally.
You trade normally.
You request your first withdrawal.
Verification is triggered.
Identity may pass quickly.
Payment method proof becomes the bottleneck.
You resubmit one or two times because the document is “valid” but not “acceptable.”
That is the gap.
Even the better platform guides still describe the clean, official version. But they rarely capture the practical pain point: the payment method evidence is where many first withdrawals stall.
That is why I now tell traders this:
Your first payout is not a withdrawal test. It is a documentation test disguised as a withdrawal.
The Best Way I Found to Pass Binomo KYC Without Drama
I do not believe in “guaranteed approval” advice. Too many variables.
But I do believe in reducing obvious rejection triggers.
Here is the exact workflow I now follow:
I register under my real legal name only
I deposit with one payment method only for the first cycle
I avoid mixing cards, e-wallets, and crypto on day one
I save the deposit receipt immediately
I prepare one clean ID option before I even request a withdrawal
If the card is virtual or unnamed, I prepare ownership proof before they ask
That last one is the killer move.
Most traders wait until the rejection email.
I do not.
I treat Binomo verification (KYC) for first withdrawal like a compliance event I can prepare for in advance.
My Final Take on Binomo Verification (KYC) for First Withdrawal
Here is the honest version.
Binomo verification (KYC) for first withdrawal is not automatically a red flag.
But it is absolutely a friction point.
And the friction usually comes from document mismatch, not some secret conspiracy.
If you use your real name, fund with one method, avoid bonus complications, and prepare the exact ownership proof for your payment method before you click withdraw, your odds improve dramatically.
The biggest trap is not “bad luck.”
It is assuming a valid document is automatically an acceptable document.
That assumption cost me time on my first payout.
It does not cost me time anymore.
If you are about to test your first Binomo withdrawal, keep it small, keep it clean, and treat the KYC stage as part of the trade lifecycle.
Because the first real proof that a broker works is not your win rate.
It is whether your first withdrawal clears without a document loop.
If you want to follow the same low-risk approach I use, open your Binomo account here, make one small deposit with one method, and run a test withdrawal early before you ever scale.
Quick FAQ (Based on My Real Workflow)
Can I complete Binomo verification before my first withdrawal?
Usually, the main verification flow appears when you request a withdrawal, not necessarily at signup. That is why I prepare documents early even if the prompt has not appeared yet.
Which document causes the most first-withdrawal rejections?
In my experience, it is usually the payment method proof, especially non-personalized cards, virtual cards, or weak bank statements.
Is a virtual card enough for Binomo verification?
Sometimes yes, but only if the screenshot clearly proves ownership. If the card view does not show your name, you may need a supporting statement or linked account proof.
Should I use multiple deposit methods on a fresh account?
I would not. For the first cycle, one method only. It keeps the KYC trail cleaner and reduces unnecessary payment-method verification layers.
Binomo Deposit/Withdrawal: Why Using Different Payment Methods Causes Delays
The first time I hit a decent withdrawal on Binomo, I thought the hard part was over.
I had done the trades. I had managed the risk better than usual. I had finally resisted the urge to overtrade after a win streak. So when I clicked withdraw, I expected the money to move as smoothly as the deposit had.
It didn’t.
That was the moment I learned a rule most traders only discover after a delay: Binomo deposit and withdrawal rules get a lot stricter when you use different payment methods.
And honestly, that’s the part most Google results and AI answers still explain badly. They usually say “verify your account” or “use the same method,” but they rarely explain why switching methods creates delays, what actually happens behind the scenes, or how to avoid triggering extra checks.
If you’re planning to start fresh and avoid that headache from day one, open your Binomo account here and set up your payment method correctly from the start.
This is the version I wish someone gave me before I made my first avoidable mistake.
What happened when I used different payment methods on Binomo
My first deposit was small.
I used one method because it was fast and convenient. Later, when I wanted to top up again, I used a different one because the first option was temporarily inconvenient on my side. At the time, it felt harmless. Money is money, right?
That’s how most beginners think.
Then came the withdrawal.
Instead of a clean request, I ended up with a pending status longer than I expected. No instant panic, but enough delay to make me start checking transaction history every hour. That’s when I realized something important:
On platforms like Binomo, your deposit path and your withdrawal path are connected.
It’s not just about “can they pay?” It’s about anti-fraud controls, payment provider rules, and ownership verification.
That’s the missing context most surface-level articles skip.
The Binomo rule most people misunderstand
Here’s the simplest way I explain it now:
If you deposit with Method A and try to withdraw through Method B, you increase the chance of delays.
Not always a full rejection. Not always a disaster. But definitely a higher chance of:
payment method verification requests
extra document checks
manual review
longer pending status
partial payout routing
support conversations you could have avoided
This is why the phrase Binomo deposit and withdrawal rule explained matters more than it sounds.
The rule is not there just to annoy traders. It exists because payment processors and trading platforms are trying to prevent:
stolen cards being used for deposits
third-party wallets being used for withdrawals
chargeback abuse
identity mismatch
money laundering patterns
That sounds obvious when you read it slowly.
But when you’re in “just fund the account and trade” mode, it’s easy to ignore.
Why using different payment methods causes delays on Binomo
This is the real content gap I kept noticing in top search results.
Most pages tell you what to do. Very few explain why the delay actually happens.
1) The platform has to confirm the money trail
If you deposited with a bank card, then suddenly request a withdrawal to an e-wallet or crypto method, the platform may need to confirm:
Is this the same person?
Is the new payout method under the same legal owner?
Was the original deposit method already fully verified?
Is the payout route even supported for that funding source in that region?
That’s not always automatic.
2) Payment providers have their own compliance rules
Even if Binomo approves the withdrawal internally, the payment provider may create friction.
Cards, e-wallets, and crypto don’t all behave the same. Some providers are fine for deposits but limited for payouts in certain countries. That means a trader can assume a method is available simply because they used it to deposit, then find out withdrawal rules are narrower.
3) New method = new verification event
This one caught me off guard.
Even if your identity was already accepted, your payment method history can still create a fresh review cycle.
That’s why a trader can feel “fully verified” and still get delayed when trying to withdraw after using a new deposit route.
4) Mixed methods can complicate payout priority
In practice, some platforms try to return funds through the original source first before allowing profit distribution elsewhere.
That’s where traders get confused.
They think: “I deposited with card, then later with wallet, so I’ll just withdraw everything to wallet.”
But the platform may not see it that simply.
My personal rule now: one method in, same method out
After that first scare, I changed my process completely.
I now treat payment methods the same way I treat trade entries: simple, consistent, and documented.
Here’s the rule I follow:
One verified payment method for the first deposit, the same method for the first withdrawal, and no unnecessary switching until the payout cycle is proven.
That single habit reduced almost all avoidable stress for me.
If you’re serious about doing it cleanly from day one, open your Binomo account through this link, verify early, and stick to one deposit/withdrawal route until you complete your first successful payout.
That’s not hype. That’s just what I’d do again if I had to start from zero.
My practical Binomo payment workflow now
Here’s the exact framework I wish I had from the beginning.
Stage
What I do now
Why it matters
Account setup
Use my real legal name only
Prevents ID/payment mismatch
First deposit
Choose one payment method I fully control
Reduces verification complexity
Before trading bigger
Verify ID and payment method early if requested
Avoids last-minute withdrawal shock
Second deposit
Prefer the same method again
Keeps funding history clean
First withdrawal
Withdraw through the same verified method
Lowest-friction payout path
After successful payout
Only then test alternatives carefully
Reduces unnecessary delays
That table alone would have saved me a lot of refreshing and guessing.
What top search results usually miss
This is where I think most “Binomo deposit and withdrawal rule explained” content is too shallow.
They often miss these four realities:
Deposits can be easy while withdrawals are strict
A fast deposit creates false confidence.
Traders assume the same smoothness applies to withdrawals. It doesn’t always.
Verification is not just identity verification
A lot of traders think KYC means “upload passport and done.”
Not quite.
Your payment method can become part of the review process too, especially when you switch methods or introduce a new one late.
Delays are often “compliance delays,” not necessarily platform refusal
That distinction matters.
A pending withdrawal is not automatically a scam signal. Sometimes it’s just a messy funding history creating extra review.
I’ve said this in other trading notes too, and it still holds:
Don’t scale deposits aggressively until your first real withdrawal is completed.
That’s also why I always tell newer traders to build better habits before they chase bigger account sizes. If someone is still learning discipline, I’d rather they start with the best way to use binary options demo accounts instead of rushing into live deposits. And if they keep treating demo resets like a cheat code, they should read why resetting your demo balance can hurt real discipline before they even think about funding again.
What I do if a Binomo withdrawal gets delayed after using different methods
I don’t panic anymore. I go into checklist mode.
My real response checklist
I check which method I used for the first deposit
I compare it with the withdrawal method I selected
I confirm whether the payment method is already verified
I review whether I recently added a new card or wallet
I check for name mismatches between account and payment method
I save screenshots of deposit, withdrawal, and status history
I contact support with one clean message instead of sending five emotional ones
That last point matters more than people think.
Support responds faster when you send:
account email
withdrawal ID
deposit method used
withdrawal method selected
screenshots
clear question: “Does this withdrawal require payment method re-verification due to a different deposit method?”
My honest take on the safest payment strategy for Binomo
If I had to simplify everything into one recommendation:
Use the same verified method for deposit and withdrawal until you complete at least one successful payout.
If I’m testing a new method, I do it in this order:
Small deposit
Verify method if requested
Small withdrawal
Confirm payout timing
Only then scale
That’s the difference between trading like a gambler and operating like someone protecting cash flow.
And if you’re opening a fresh account anyway, use this Binomo signup link, keep your first deposit simple, and treat your first withdrawal like a systems test, not just a cash-out.
That mindset saves more time than any indicator ever will.
Why this rule matters even more than strategy when you’re still improving
This is the part a lot of traders hate hearing.
They’ll spend hours testing entries, but almost no time designing a payout-safe workflow.
That’s backwards.
Before I got stricter with payment methods, I used to obsess over indicators. And yes, entries matter. But a clean withdrawal path matters just as much if you want your trading to feel real instead of theoretical.
If readers want to sharpen the actual trading side while keeping the money side disciplined, these are the kinds of internal resources that fit naturally here:
Final verdict: Binomo isn’t just about trading, it’s about payout discipline
My biggest lesson wasn’t about chart entries.
It was this:
A good trade means very little if your payment setup is sloppy.
That’s why Binomo deposit and withdrawal rule explained is more than a support topic. It’s part of risk management.
Using different payment methods does not always mean your withdrawal will fail. But in my experience, it absolutely increases the odds of delays, extra checks, and unnecessary friction.
So my rule now is simple:
one name
one verified method
one clean funding trail
one successful withdrawal before scaling
That’s how I trade now. And honestly, it’s one of the few habits that has saved me more stress than any strategy upgrade ever did.
If you want to avoid the exact mistake I made, start your Binomo account here, keep your first payment method consistent, and make your first withdrawal your real test before you scale anything.
Binomo Withdrawal Pending: Real Reasons, Timelines, and What to Do at Each Hour Mark
The first time I saw Binomo withdrawal pending on my screen, I stopped caring about my trades for the day.
Not because the amount was huge. It wasn’t.
What bothered me was the uncertainty.
When you trade on a platform like Binomo, the real test isn’t the deposit button. It’s the withdrawal button. Depositing is easy on almost every platform. Getting your money out smoothly is what tells you whether the setup is usable long term.
That’s why I still remember that first pending withdrawal so clearly.
I had done what I always do on high-risk trading platforms: deposit small, take a few controlled trades, then request a withdrawal before scaling anything. I wasn’t trying to maximize profit. I was trying to answer one simple question:
Can I actually get paid without friction?
Then the request sat there.
Pending.
And like most traders, I started running through every possibility in my head. Was it normal? Was it a verification issue? Did I trigger a review? Was the payment method wrong? Or was this the beginning of the kind of platform problem traders only talk about after it’s too late?
When I searched for answers, I found the same weak content over and over:
generic “wait 1 to 3 days” advice
vague mentions of verification
no real explanation of what to do at each stage
no distinction between a normal delay and a real warning sign
That’s the gap I want to fill here.
This is not another shallow FAQ. This is my practical, real-world breakdown of Binomo withdrawal pending based on how I actually evaluate withdrawal delays as part of my trading risk management.
If you’re planning to test Binomo the smart way, start small and treat your first withdrawal like the real platform audit. If you want to do that, you can open a Binomo account through our affiliate link and follow the same cautious setup I use.
Why most Binomo withdrawal pending articles don’t actually help
The problem with most content on this topic is simple.
It tells you how long a withdrawal can take, but not what the delay actually means.
That’s a huge difference.
When I see Binomo withdrawal pending, I don’t just ask, “How many hours has it been?”
I ask:
Is it still inside Binomo’s internal approval stage?
Has it already been passed to the payment provider?
Is this normal for my account level?
Is there a hidden KYC or payment-method issue?
Did I accidentally create friction with a bonus or a mismatched withdrawal route?
Those are the questions that matter.
A pending withdrawal is not automatically a scam sign. But it’s also not something I casually ignore.
It’s a platform trust signal.
My rule with Binomo: the first withdrawal matters more than the first profit
I’ve learned this the hard way over the years.
The first withdrawal is not about making money. The first withdrawal is about testing reliability.
That’s why I never treat my first few trades on a new broker or binary platform as “serious scaling.” I treat them as a live platform audit.
My usual sequence looks like this:
deposit a modest amount
trade normally, not recklessly
avoid unnecessary bonuses
request a partial withdrawal early
study how the platform handles the payout
That’s exactly what I did on Binomo.
And when the withdrawal stayed pending, it taught me something important:
“Pending” can mean multiple things, and most traders don’t separate them properly.
In practical terms, a Binomo withdrawal pending status usually falls into one of two buckets:
Binomo has not approved the request yet
Binomo approved it, but the payment provider is still slow
If you don’t know which stage you’re in, you can easily overreact too early or wait too long when something actually needs attention.
What Binomo withdrawal pending really means in real life
Here’s how I personally interpret it.
1) The withdrawal is still inside Binomo’s internal review queue
This is the stage where the platform itself hasn’t completed approval yet.
This is where most stress happens because you don’t know if the delay is routine or if your account has triggered extra review.
Typical reasons this stage takes longer:
incomplete verification
payment method review
account mismatch
active bonus conditions
unusual withdrawal amount
queue congestion
manual compliance checks
This is the stage where your account setup matters most.
2) The withdrawal has already been approved, but the payment rail is slow
This is the second stage many traders misunderstand.
Sometimes Binomo has already done its part, but the money is still moving through:
bank processing
card settlement
e-wallet routing
local banking cutoffs
regional payment provider delays
At that point, the issue is less about the broker and more about the transfer rail.
That’s why I always try to figure out which stage I’m in before assuming anything.
The real reasons my Binomo withdrawal stayed pending longer than expected
From my experience, most delayed withdrawals aren’t random.
They usually come from a small set of repeatable causes.
1) Verification looked “done” but wasn’t fully clean
This is the most common trap.
A lot of traders assume that because they can deposit and trade, their account is fully ready for withdrawals.
That’s not always true.
You might have:
basic account access approved
identity partially verified
but payment method verification still unresolved
That gap causes more delays than most traders realize.
Things that can quietly slow approval:
blurry ID upload
cropped document edges
name mismatch
expired or weak proof of address
payment method not verified
virtual or non-personalized card issues
I now treat verification as a withdrawal process, not just a signup process.
2) I had a bonus active or some turnover condition I didn’t fully respect
This is one of the easiest mistakes to make.
Bonuses feel good when you deposit. They often feel terrible when you try to withdraw.
If you accepted a deposit bonus and there’s a turnover condition attached to it, your withdrawal can become slower, restricted, or reviewed more aggressively.
This is why I now follow a simple rule:
If I can’t explain the bonus withdrawal condition in one sentence, I don’t take the bonus.
On risky trading platforms, clean withdrawals matter more than small bonus boosts.
3) I used the wrong withdrawal route for my region
This is something almost nobody explains properly.
Not every payment method behaves equally well in every country.
A method that works smoothly for one trader can be awkward, delayed, or less predictable for another depending on:
country
local banking rules
card compatibility
wallet availability
bank cutoffs
processor behavior
This is why I never blindly copy another trader’s “best withdrawal method.”
I test what actually works best in my region.
4) My withdrawal size looked normal to me, but unusual to the platform
This is another subtle one.
Imagine this pattern:
small deposit
a few aggressive trades
sudden profit spike
immediate large withdrawal
Even if everything is legitimate, that can trigger extra scrutiny.
That doesn’t automatically mean something is wrong.
But it can mean slower review.
That’s why I often prefer this sequence:
first small proof withdrawal
second moderate withdrawal
only then scale up if everything behaves normally
5) I requested during a bad timing window
This sounds boring, but it matters.
Weekends, public holidays, local banking cutoffs, and payment congestion can make a normal withdrawal look suspiciously slow.
I’ve seen traders panic over delays that were basically caused by terrible timing.
That’s why I judge withdrawals by business windows, not just raw clock hours.
My Binomo withdrawal pending response plan (hour by hour)
This is the part I wish more articles covered.
When I see Binomo withdrawal pending, I don’t just “wait and hope.”
I follow a simple timeline.
Hour 0 to 1: Document everything and do nothing reckless
As soon as I submit the request, I do three things:
screenshot the confirmation page
screenshot transaction history
note the exact amount, method, date, and time
That first hour is not a crisis.
It’s a documentation window.
I do not:
cancel the request
resubmit another withdrawal
spam the app
open multiple support chats
I simply confirm:
correct payment method
correct amount
no visible KYC banner
no obvious bonus restriction
Hour 1 to 4: Check whether the delay matches the account type
At this stage, I ask a simple question:
Is this actually late for my account, or am I just impatient?
This matters because different account levels can have different expectations.
A few hours may feel uncomfortable, but it may still be totally normal depending on the situation.
What I check:
has the status wording changed?
is it still pure pending?
does the interface suggest movement into processing?
is there any email or notification update?
If the status changes, that’s usually a good sign.
Hour 4 to 12: Audit the hidden blockers before support does
This is where I stop staring at the timer and start looking for causes.
My checklist is simple:
Checkpoint
What I Check
Why It Matters
KYC status
Is identity fully verified?
Partial KYC often delays payouts
Payment method
Is the exact method verified?
This is often missed
Bonus status
Any active bonus or turnover?
Can slow or restrict withdrawals
Method mismatch
Same route as deposit?
Mismatches trigger review
Withdrawal size
Bigger than usual?
Large jumps can get manual checks
Region fit
Is this the best method locally?
Some rails are slower by country
If I find a likely issue, I prepare for support before I even message them.
Hour 12 to 24: First support message if the delay feels off-pattern
This is where I contact support only if something looks abnormal for my case.
My message is always short and factual:
Hi, my withdrawal request is still showing pending. Submitted at: [time/date] Amount: [amount] Method: [payment method] Account email: [email] I’ve attached screenshots. Please confirm whether the withdrawal is still under internal review or has already been passed to the payment provider.
That last line matters a lot.
I’m not asking, “Where is my money?”
I’m asking which stage the request is in.
That usually gets a better answer.
If you’re using Binomo for the first time, this is exactly why I always recommend starting with a small account and an early test withdrawal. If you want to follow the same process, open your account through our affiliate link and treat the first payout as your real due diligence.
Hour 24 to 48: This is where a normal delay starts becoming a real review event
By this point, I’m no longer casually monitoring.
I’m actively diagnosing.
If the status changed from pending to processing, I usually assume the money is now in the payment-provider stage.
That’s annoying, but not automatically dangerous.
If it’s still stuck on pure pending with no real movement, I treat it as an internal hold until proven otherwise.
At this stage, the likely causes are usually:
manual compliance review
KYC issue
payment method verification problem
bonus turnover conflict
method mismatch
unusual withdrawal behavior
internal queue delay
What I do here:
send one clean follow-up if needed
avoid opening duplicate tickets
stop making new deposits
pause additional trading if I’m testing platform reliability
That last one matters.
If a platform’s exit is uncertain, I do not keep feeding it more capital.
Hour 48 to 72: Escalate with clean evidence, not emotion
Once a Binomo withdrawal pending status reaches this zone, I stop guessing.
I build a clean case file:
original request screenshot
current status screenshot
account email
withdrawal amount
payment method
proof KYC is complete
proof payment method is verified
note whether a bonus is active or not
short timeline of what happened
This makes support more likely to give a useful answer.
It also protects me if the explanation changes later.
And yes, I’ve seen that happen before on different platforms.
After 72 hours: what I consider normal vs what I consider a warning sign
This is where experience matters more than emotion.
A delayed withdrawal can still be within a broad “possible” window depending on:
account level
payment method
weekends
local bank delays
holidays
provider congestion
But I still separate it into three categories.
Still annoying, but not a serious alarm yet
status moved into processing
support confirms it left internal review
payment method is known to be slower
the request hit a weekend or holiday window
Yellow flag
no meaningful status change for 48+ hours
support only gives copy-paste replies
repeated “please wait” messages without clarity
sudden extra document requests after you thought verification was done
Red flag
contradictory support answers
status disappears or loops
same documents requested repeatedly
new restrictions appear only after profit withdrawal
no clear stage confirmation after several business days
That’s the difference between a delay and a pattern.
And patterns are what matter.
The biggest mistake traders make with Binomo withdrawal delays
The biggest mistake is confusing three different problems:
Trading loss
Normal withdrawal friction
Actual platform risk
A lot of traders overtrade, ignore bonuses, skip proper verification, then request a large payout and immediately assume fraud when the withdrawal slows down.
That’s not a useful way to assess risk.
At the same time, blindly trusting a platform and “just waiting” forever is also a bad move.
The better approach is simple:
understand the stage
document everything
verify your setup
escalate cleanly
stop scaling capital until withdrawals prove reliable
That’s the middle ground most articles miss.
What I would do differently if I opened Binomo again from scratch
If I were starting over, my process would be even cleaner.
My ideal first-time Binomo setup
deposit small
verify identity early
verify payment method before the first serious withdrawal
avoid bonuses unless I fully understand them
make a small first withdrawal before trying to scale
test the most reliable payment route for my country
never confuse a winning streak with platform trust
That last one is important.
A platform can feel amazing while you’re winning.
The real test begins when you want your money back.
If you want to understand the broader risk side of binary and broker-style platforms, these related reads on Becoin are worth checking next:
Important note: if you already have dedicated Binomo articles live on Becoin, replace 2 to 3 of the broader links above with exact Binomo-related URLs before publishing. That will strengthen topical relevance and improve session flow.
My honest verdict on Binomo withdrawal pending
If you search Binomo withdrawal pending, you usually get one of two bad answers:
“Relax, just wait.”
“It’s a scam.”
My honest answer is more useful than both.
Sometimes it’s completely normal. Sometimes it’s just a standard approval delay. Sometimes it’s a payment rail issue. Sometimes it’s a hidden KYC problem. Sometimes it’s a bonus trap. And sometimes it’s the first sign that you should not trust the platform with larger money.
That’s why I don’t treat withdrawals like a minor support issue.
I treat them like a risk-management event.
If the status is still inside a reasonable window, I stay calm and document. If it starts drifting beyond what feels normal, I audit my setup. If it enters the 48 to 72 hour zone without clarity, I escalate cleanly. If it becomes a pattern, I stop scaling capital.
That’s the real lesson.
Not blind patience. Not instant panic. Just disciplined testing.
And if you haven’t opened Binomo yet, the smartest way to start is simple:
Deposit small. Verify early. Withdraw early. Judge the platform by the first payout, not by the first win.
If you want to test Binomo the same way I do, you can open your account through our affiliate link and use the same small-account withdrawal strategy before trusting it with bigger money.
Quick Reference Table: My Binomo Withdrawal Pending Cheat Sheet
Time Since Request
My Read
What I Do
0–1 hour
Normal
Screenshot everything and verify details
1–4 hours
Usually normal
Check status movement and account expectations
4–12 hours
Time to audit
Review KYC, payment method, bonus, mismatch
12–24 hours
Possible first support contact
Ask which stage the withdrawal is in
24–48 hours
Real review window
Follow up once, stop new deposits
48–72 hours
Escalation zone
Build evidence and push cleanly
3–7 days
Serious caution
Separate provider delay from internal hold
7+ days
Strong red flag
Escalate firmly and stop scaling capital
FAQ
Why is my Binomo withdrawal pending?
A Binomo withdrawal pending status usually means the request is either still under internal review or it has been passed to the payment provider but not fully completed yet. The most common causes are verification issues, payment method checks, bonus conditions, unusual withdrawal size, or simple banking delays.
How long does Binomo withdrawal pending take?
In many cases, a Binomo withdrawal pending request can clear within a few hours, but some users may see longer delays depending on account level, payment method, weekends, or manual review. In my experience, the key is not just the number of hours, but whether the status is still under internal review or already in payment processing.
Is Binomo withdrawal pending normal?
Yes, a pending status can be normal, especially in the early hours after a request. It becomes more important to investigate when there’s no status movement for 24 to 48 hours, or when support cannot clearly explain which stage the withdrawal is in.
What should I do if my Binomo withdrawal is still pending after 48 hours?
After 48 hours, I stop waiting passively. I gather screenshots, confirm KYC and payment method verification, check for bonus conditions, and contact support with a short factual message asking whether the withdrawal is still under internal review or already passed to the payment provider.
Should I keep trading while my Binomo withdrawal is pending?
Personally, no. If I’m testing a platform’s reliability and a withdrawal is delayed beyond what feels normal, I pause new deposits and avoid additional trading until the exit path is clear.
Manage Consent
We use cookies to store and access device data. Consent lets us process browsing behavior or unique IDs. Without it, some features may not work properly.
Functional
Always active
The technical storage or access is strictly necessary for the legitimate purpose of enabling the use of a specific service explicitly requested by the subscriber or user, or for the sole purpose of carrying out the transmission of a communication over an electronic communications network.
Preferences
The technical storage or access is necessary for the legitimate purpose of storing preferences that are not requested by the subscriber or user.
Statistics
The technical storage or access that is used exclusively for statistical purposes.The technical storage or access that is used exclusively for anonymous statistical purposes. Without a subpoena, voluntary compliance on the part of your Internet Service Provider, or additional records from a third party, information stored or retrieved for this purpose alone cannot usually be used to identify you.
Marketing
The technical storage or access is required to create user profiles to send advertising, or to track the user on a website or across several websites for similar marketing purposes.