How Many Trades Should You Take in a Day?
When I started trading binary options, I used to think more trades meant more chances to win. I’d take ten, sometimes twenty positions in a day, jumping between EUR/USD, GBP/JPY, and even gold. It felt productive, like I was working hard. But soon, I realized I wasn’t building consistency; I was chasing adrenaline.
Binary options trading isn’t about frequency, it’s about precision. Over time, I learned that how many trades you take in a day can decide whether you grow your account or slowly bleed it out.
Start trading smarter, not harder. Open your account now and apply these trade frequency principles in real markets.
The “More Trades, More Profit” Myth
In my early weeks, I believed that the market rewards activity. I’d open positions every 15 minutes, driven by every candle twitch. But when I reviewed my journal, something hit me; my best days weren’t the busiest ones. They were the ones with just two or three carefully planned trades.
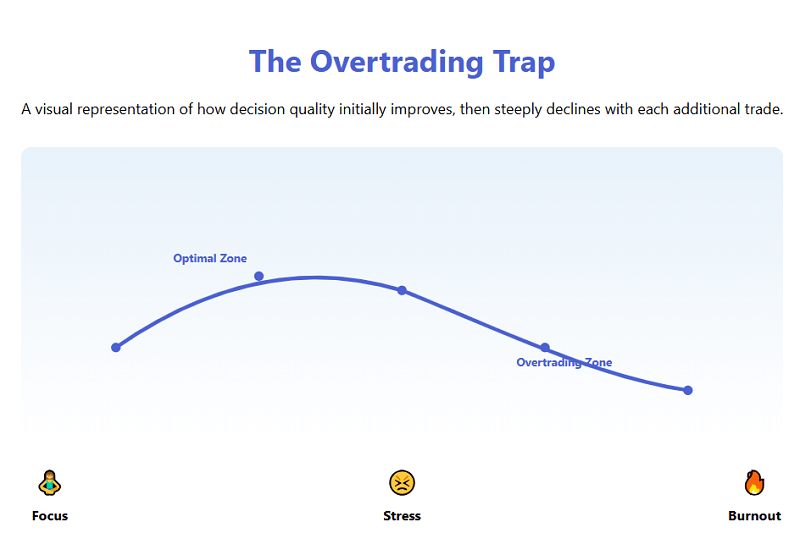
The problem with overtrading isn’t just losing trades; it’s losing focus. Every decision drains mental energy, and by the 10th or 12th position, you’re reacting, not thinking.
My Early Mistake
I used to:
- Trade every setup that looked “good enough.”
- Jump between assets to find constant action.
- Chase losses with double positions.
The result? A mix of small wins and huge emotional drawdowns.
How I Found My Daily Trade Limit
After a month of chaos, I decided to test different trading frequencies. For 30 days, I tracked performance under three conditions:
| Trading Frequency | Avg. Daily Trades | Win Rate | Net Result (per week) |
| High frequency | 15–20 | 48% | -6.4% |
| Moderate | 5–7 | 61% | +3.2% |
| Low frequency | 2–3 | 68% | +7.1% |
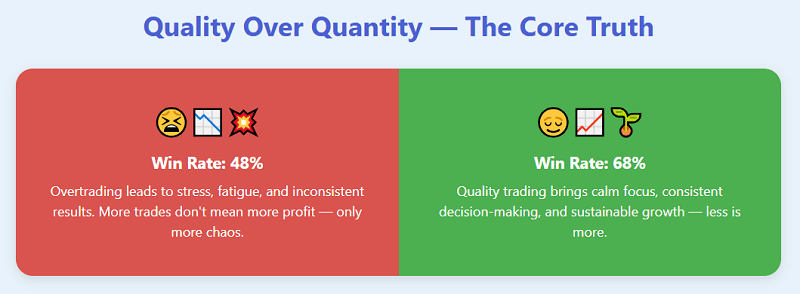
The data was clear, fewer, higher-quality trades outperformed.
But there was more behind it. It wasn’t just about probability; it was about psychology.
When I took fewer trades, I spent more time preparing, checking support and resistance, validating market sentiment, and waiting for clear price behavior. My patience directly improved my profitability.
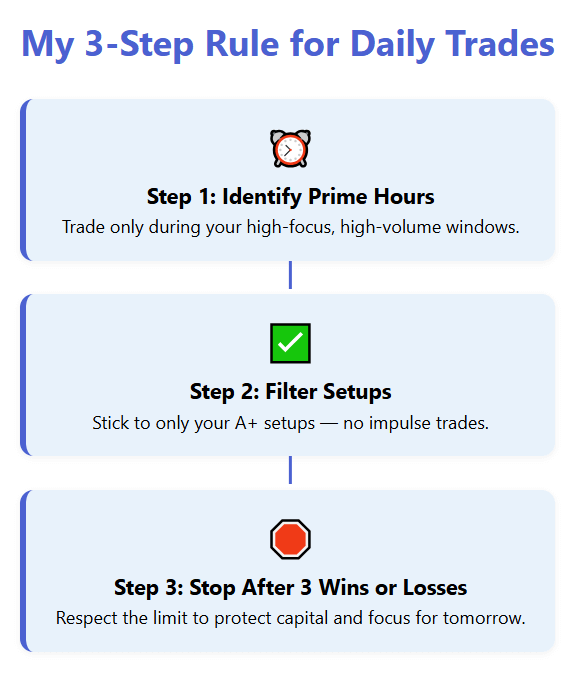
My 3-Step Rule for Daily Trade Count
Through experience, I developed a simple system that prevents overtrading while keeping me active enough to capitalize on real opportunities.
Step 1: Identify “Prime Hours”
I trade only when volume and volatility overlap, usually during the London-New York overlap. It’s where price moves are clean and meaningful, not choppy.
Step 2: Quality Over Quantity Filter
Before each trade, I ask:
- Does this setup align with my strategy?
- Is the price reacting at a key level (support/resistance)?
- Do I feel calm and detached, not desperate?
If I can’t answer “yes” to all three, I skip it. That filter alone cuts down 50% of potential trades.
Step 3: Stop After the Third Trade
Three trades a day, that’s my upper limit. Win or lose, I walk away. This rule protects me from decision fatigue and revenge trading.
Emotional Impact of Trade Frequency
Too many traders underestimate the mental cost of overtrading.
The more you trade, the more dopamine cycles you create, and each loss hits harder. By trade number six, logic gives way to emotion.
I noticed that after two consecutive wins, I’d get overconfident. After two losses, I’d start forcing setups to recover. The more trades I took, the faster I slipped into emotional trading loops.
That’s when I understood: my mental energy is a currency as valuable as my capital.
How Many Trades Should You Really Take?
There’s no universal number, but from my experience:
- Beginners: 1–3 trades per day (build discipline).
- Intermediate: 3–5 trades per day (with a proven strategy).
- Advanced: Up to 7, only if setups are validated across timeframes.
You should only increase frequency when you’ve mastered your emotional control and risk limits. Otherwise, more trades just amplify your weaknesses.
Ready to test your trading discipline? Open a demo or live account today and apply the “3-trades-per-day” rule for one week.
What Happens When You Trade Less but Smarter
After I adopted the 3-trade rule, everything changed:
- My equity curve became smoother.
- I started ending days neutral or slightly positive instead of wildly fluctuating.
- I had mental energy left for journaling and reflection.
I also began to see the market better. Waiting taught me patience, and patience improved my accuracy.
| Before (Overtrading) | After (Controlled Trading) |
| 20+ trades daily | 3 trades max |
| Constant emotional swings | Calm, consistent mindset |
| 48% win rate | 68% win rate |
| Frequent account resets | Steady growth |
How I Decide Whether to Take One More Trade
By mid-afternoon, I check two things:
- Am I emotionally stable? (No frustration, no rush)
- Is the setup as clear as the first one I took today?
If either answer is “no,” I stop trading.
Sometimes the best trade is no trade at all, and that’s a truth I had to learn the hard way.
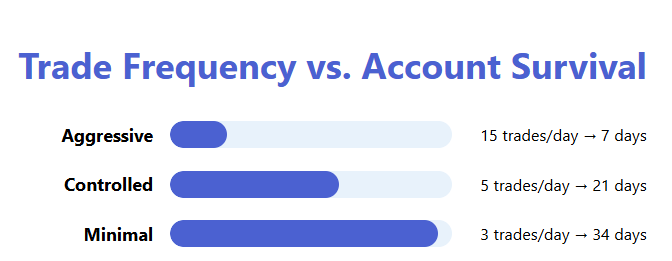
How Trade Frequency Affects Account Survival
Think of your daily trades like bullets in a revolver. The more you fire, the sooner you run out of ammunition, especially if your accuracy is low. I tested this idea by simulating 100 trades under different daily limits:
| Strategy | Max Trades per Day | Duration (Days Before Drawdown) |
| Aggressive (10–15/day) | 15 | 7 |
| Controlled (3–5/day) | 5 | 21 |
| Minimal (1–3/day) | 3 | 34 |
The slower, more selective trader always survives longer. Consistency beats intensity.
Final Thoughts: Fewer Trades, Longer Survival
The question isn’t how many trades you can take, but how many you should.
For me, the sweet spot lies at three. It keeps me engaged but not drained, focused but not fixated. Once I hit my daily limit, I review, record, and rest because sustainable trading isn’t about chasing opportunities; it’s about managing yourself.
Trade with focus, not frequency. Open your trading account today and put the “quality over quantity” rule into action.
Take Control of Your Trading Discipline
Trade smarter. Trade fewer. Trade better.
Start Trading WiselyConsistency beats frequency — every time.
Binary Options Money Management Rules Beginners Ignore

When I started trading binary options, I thought I had it all figured out. The charts, the patterns, the entry points, everything seemed clear. But it wasn’t the market that took my balance down; it was my own lack of money management. My early trades weren’t about bad signals, they were about bad discipline. Over time, I learned that your win rate means nothing if your stake sizing and capital exposure are out of control.
If you’re serious about trading, start with the foundation, money management. Open an account via our affiliate link and see how consistent, disciplined risk control actually feels.
The Cost of Ignoring Rules I Didn’t Know Existed
I remember the first month I went live. I had $500 in my account and thought that betting $25 per trade was “reasonable.” After all, it was only 5% of my account. But after a series of losses, I realized I had no plan for recovery, or protection. I wasn’t compounding. I wasn’t adjusting for volatility. I was reacting emotionally, not managing systematically.
Here’s what I learned quickly: money management is the trader’s real edge, not the entry strategy.
The Three Core Rules Beginners Often Break
Through trial, error, and a fair share of losses, I found there are three core money management rules beginners ignore, and each one can destroy an otherwise promising system.
1. Risking More Than 2% Per Trade
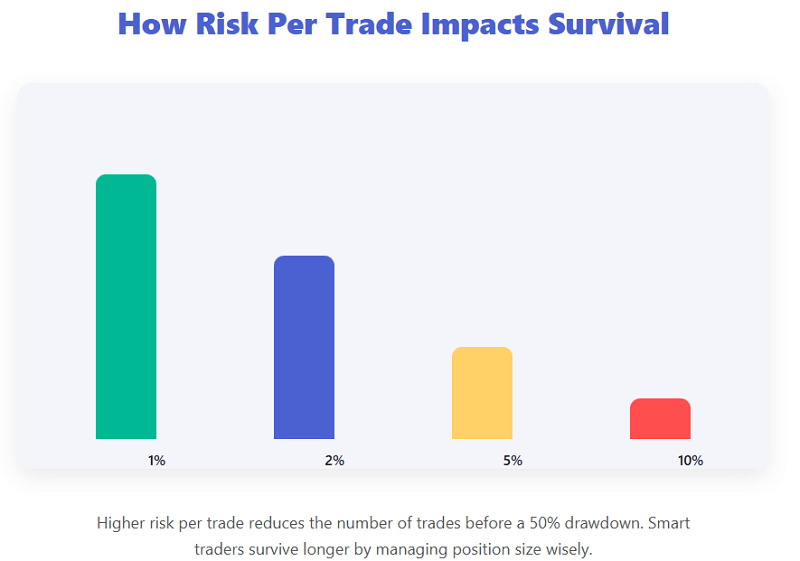
When you’re starting out, 2% sounds painfully small. But the math is unforgiving. Risking 5–10% per trade gives you less than 20 consecutive losses before your account collapses. That might sound extreme, but markets can go cold for weeks.
Here’s a simple look at how risk percentage impacts survival:
| Risk Per Trade | Max Consecutive Losses Before 50% Drawdown |
| 1% | 34 |
| 2% | 17 |
| 5% | 7 |
| 10% | 3 |
I didn’t believe these numbers until I saw my balance spiral. Lowering my risk per trade was the first decision that made me last longer in the market.
2. Doubling Down After a Loss
I used to think the Martingale method was logical, “If I double after each loss, I’ll recover everything plus profit.” What I didn’t consider was string losses. A 5-step losing streak wiped out half my account. That’s when I learned that chasing losses is not recovery, it’s destruction.
Instead, I started using a fixed stake model. It was slower, yes, but it stabilized my emotions. My chart reading improved because I wasn’t trading scared anymore.
3. Ignoring Compound Growth
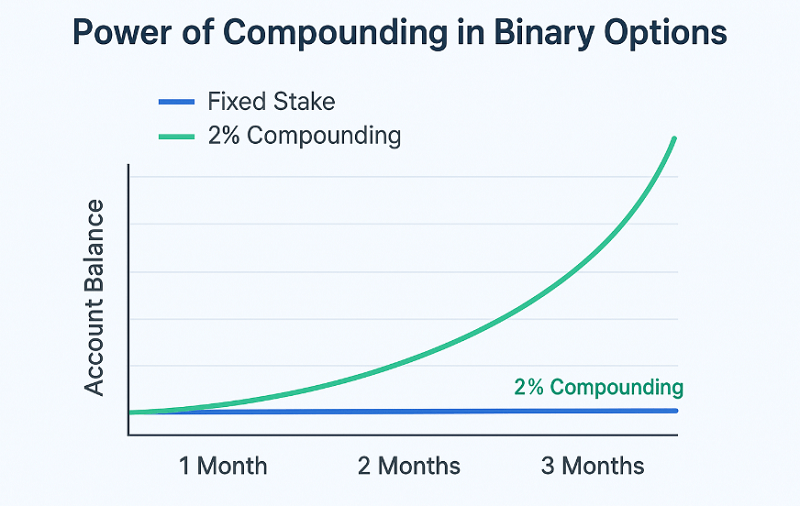
Most beginners want instant profits. I did too. But compounding changed my approach completely. When I started reinvesting small portions of profits systematically, I noticed something remarkable: my account grew even when my win rate didn’t improve.
To illustrate:
| Strategy | Average Win Rate | Account Growth (3 Months) |
| Fixed stake, no compounding | 62% | +5% |
| Fixed stake with 2% compounding | 62% | +22% |
It was proof that growth isn’t just about accuracy; it’s about how much you let your profits work for you.
The Turning Point: When I Stopped Thinking Like a Gambler
There was one evening I remember vividly, three losing trades back-to-back on EUR/USD. My instinct told me to double down and recover. Instead, I closed the laptop. The next day, I re-entered calmly, with my same fixed risk and a clear head. That trade won. Not because my setup was better, but because my psychology was stable.
That’s when I realized that discipline is the most underrated money management rule of all.
Ready to trade with focus and structure? Open an account via our affiliate link and start applying these rules from day one.
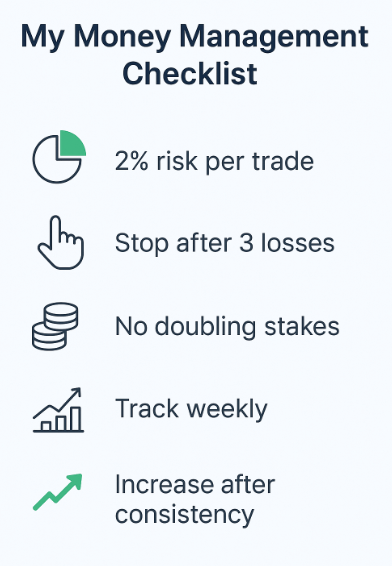
My Personal Money Management Checklist
These aren’t theoretical rules. They’re scars turned into systems, habits I still use daily:
- I risk no more than 2% per trade, no matter how confident I feel.
- I stop trading after 3 consecutive losses and review setups.
- I never double stakes after losses; recovery comes from consistency.
- I track my equity curve weekly, not daily.
- I increase stakes only after 10 consecutive profitable sessions.
This checklist keeps me grounded. Without it, emotion takes over, and emotion is the silent killer of binary accounts.
How I Adapt My Money Management to Volatile Markets
When volatility spikes, I adjust position sizes even further down. I also avoid short expiries during high-impact news. It’s not about fear; it’s about survival. I treat volatility like leverage, it can amplify success or accelerate collapse.
For example, during an NFP week, I reduce my trade size by half. It’s boring, but it keeps my capital alive. And that’s the ultimate goal: staying solvent long enough for your edge to play out.
Why Beginners Keep Ignoring These Rules
The irony is that most traders know these rules. They just don’t feel their importance until they’ve blown an account. I was no different. The rush of “being right” was stronger than the need to protect capital. I ignored math for adrenaline. But once I began treating money management like a survival tool, everything changed.
Even a mediocre strategy with tight risk rules can outperform a great one with poor discipline.
The Results That Changed My View
Six months into disciplined trading, here’s what my stats looked like:
| Period | Win Rate | Drawdown | Account Growth |
| First 3 months (no rules) | 55% | -47% | -$235 |
| Next 3 months (money management applied) | 59% | -8% | +$176 |
Nothing about my analysis got sharper, my control did. That’s the reality most beginners overlook. It’s not the market that changes; it’s the trader.
Want to put these lessons into practice? Open an account via our affiliate link and start trading with your own rulebook, not your emotions.
Final Thoughts: Staying Alive Is Winning
If I could tell my beginner self one thing, it would be this, binary options trading is not about hitting home runs; it’s about staying in the game long enough to let probabilities work. Every professional I’ve met shares this quiet truth: consistent, disciplined risk management is the only thing separating survivors from the rest.
Money management isn’t sexy. It’s not exciting. But it’s the backbone of every trader who lasts longer than a few months. If you can master that, the rest will eventually fall into place.
You’ve Learned the Rules — Now It’s Time to Apply Them
You understand how risk, compounding, and discipline shape results. Take the next step — test your strategy in real market conditions and build consistency with smart money management.
🚀 Start Trading NowSupport & Resistance Trading in Binary Options (Step by Step)
When I first stumbled upon support and resistance trading in binary options, I treated those horizontal lines like magic. I thought if I could just mark them correctly, the market would respect them every time. But the truth turned out more complicated, and far more interesting. What I discovered over hundreds of trades wasn’t just how these levels work, but how they behave differently under binary expiry pressure. That distinction changed my trading approach completely.
If you’re learning this method, I recommend testing it in real chart conditions. You can open a trading account through our affiliate link and practice with a demo to see how these setups unfold in real time.
How I First Misunderstood Support and Resistance
Early on, I drew lines everywhere. Any swing high or low looked like a potential level to me. I entered trades the moment price touched one of those lines, thinking “support means bounce.” That worked sometimes, but not enough to call it a strategy. One losing streak, in particular, taught me a hard lesson: just because a line looks right doesn’t mean it has meaning.
That realization pushed me to go back through my charts, study where reversals actually occurred, and understand why some levels held while others crumbled. Support and resistance trading in binary options needed more than guesswork, it needed structure.
What Support and Resistance Really Represent
Over time, I started seeing these levels not as magic lines, but as zones of human behavior. A support zone isn’t just a line, it’s a cluster of buy orders where traders believe the price is cheap. Resistance zones are the opposite: areas where many feel the price is too high. When price reaches these zones, emotion meets order flow, and that’s where opportunity lies.
But binary options add one more variable: time. Unlike traditional trading, where you can hold a position indefinitely, binary trading forces you to predict not just direction but when the move will happen. That’s what makes expiry alignment the most overlooked skill in support and resistance setups.
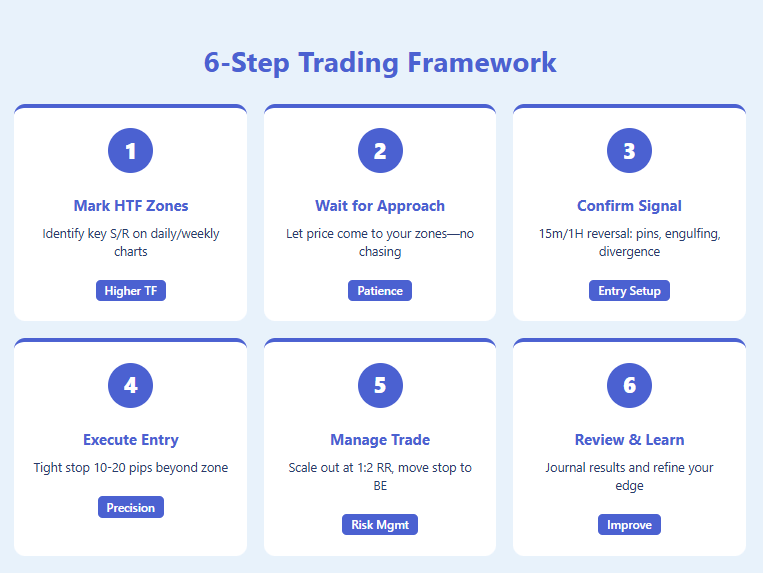
Building My Step-by-Step Framework
After months of mixed results, I built a repeatable process that brought consistency to my support and resistance trading in binary options. It wasn’t about reinventing the concept, it was about adapting it to binary expiry logic. I refined it into six clear stages.
Step 1: Start with the Bigger Picture
I always begin on higher time frames, 15-minute, 1-hour, sometimes even 4-hour charts. This is where I mark my main support and resistance zones. I look for areas where price reacted at least twice before; the more recent, the better. These levels often act like magnetic fields for short-term price action.
One mistake I used to make was focusing only on the current chart. That made my entries blind to stronger levels just outside my timeframe. Once I started zooming out, I understood why some “perfect” signals failed, they were running straight into a higher-level resistance I hadn’t seen.
Step 2: Draw Zones, Not Lines
Precision in trading can be misleading. A single line assumes the market reacts perfectly; reality is messier. I now draw zones, a small range where reactions previously occurred. This gives me breathing room to understand price action instead of panicking at every pip move. When the price reaches my zone, I wait to see whether the market respects it or cuts through it.
Step 3: Drop Down to Trading Time Frame
Once my levels are marked, I switch to a working chart, usually 1-minute or 5-minute candles depending on expiry. I watch how price behaves as it approaches those zones. Sometimes it drifts calmly; other times it races toward them. The speed of approach matters. Fast moves often overextend and snap back sharply; slow moves tend to grind through. Recognizing that difference has saved me many losses.
Step 4: Wait for a Reaction Candle
I used to trade the first touch, believing in immediate reversals. Now, I wait. A rejection candle, a pin bar, or a clear engulfing pattern tells me that one side is stepping in. If I see that confirmation near my zone, I prepare for entry. This single adjustment, waiting for reaction instead of assuming one, nearly doubled my win rate.
Step 5: Choose Expiry that Matches Market Pace
Here’s where binary trading becomes its own discipline. A support or resistance setup means little if your expiry doesn’t align with the reaction. I learned that the hard way, many of my trades were right but expired too soon. For quick bounces, I use 1–5 minute expiries. For slower reactions or range conditions, 10–15 minutes often work better. It’s about giving the market enough time to complete the story.
Step 6: Trade, Record, Review
When all factors line up, level, confirmation, expiry, I take the trade. Win or lose, I log everything: price level, pattern, expiry, outcome, and notes on reaction speed. My trading journal became my best teacher. Patterns began to appear: certain times of day offered cleaner reactions, certain pairs respected zones more consistently, and some levels acted like traps.
What My Trading Journal Revealed
After several weeks, my records exposed patterns I hadn’t noticed before. For instance, support and resistance setups during high-impact news were far less reliable. Conversely, levels tested during calmer sessions like late London or early New York often delivered sharp, predictable bounces. I also saw that “fresh” levels, ones formed within the last few hours, worked more effectively than older, recycled ones.
Here’s a snapshot from my observations:
| Market Context | Reaction Quality | Typical Expiry | Notes |
| Fresh level, calm market | Strong rejection | 3–5 min | Reliable for binary entries |
| Old level, volatile session | Unstable reaction | 10–15 min | Use smaller stake or avoid |
| News-driven move | Unpredictable | None | Skip trade entirely |
These small distinctions turned my trading from guesswork into a form of pattern recognition.
Example Trade: The Perfect Support Bounce
I remember a Friday morning trading USD/JPY. The pair had tested 148.20 twice in the last hour, clear support. When it returned there for a third time, the candle formed a long rejection wick and closed bullish. I entered a “call” with a 5-minute expiry. The next candle followed through exactly as expected, and the trade closed in profit. That success wasn’t luck; it was the result of patience and expiry matching.
Example Trade: The Resistance Trap
Another time, on EUR/USD, I saw resistance at 1.0910. The first test rejected beautifully, so I took a “put” on the second touch. But I ignored the momentum, price was climbing with increasing strength. The candle broke through my zone and held above it until expiry. I lost that trade and realized later I had traded against a building trend. Support and resistance are context-sensitive; they don’t exist in isolation.
Adapting Support and Resistance to Expiry Windows
One critical discovery was that expiry length changes the meaning of a level. On short expiries, even minor rejections can lead to wins. On longer ones, price has time to test, fake out, and return. I started mapping my expiry times to the quality of the level itself. Strong, fresh levels got short expiries; weaker or uncertain ones needed longer expiries or no trade at all.
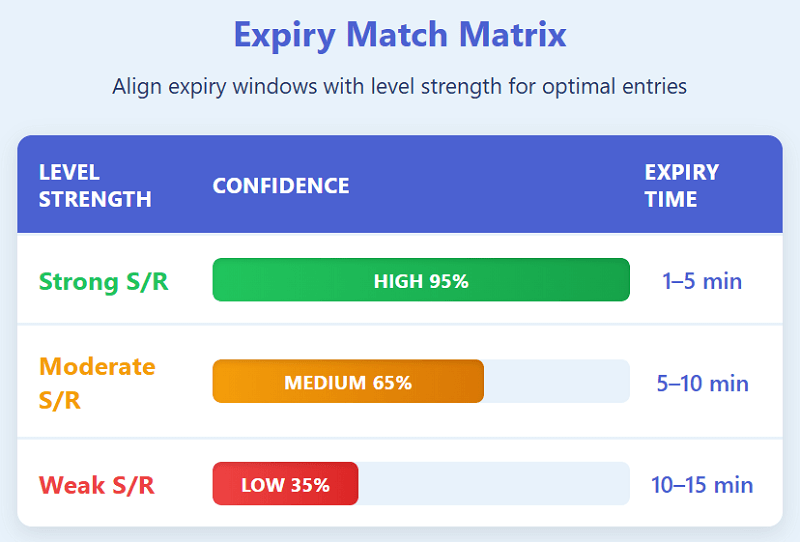
That relationship became so consistent that I summarized it in a small table I still use today:
| Level Strength | Typical Reaction | Expiry Window | Confidence |
| Strong (3+ touches) | Fast, decisive bounce | 1–5 min | High |
| Moderate (2 touches) | Slower reversal | 5–10 min | Medium |
| Weak (1 touch) | Choppy, unreliable | 10–15 min | Low |
My Biggest Turning Point
There was one week where I took 20 trades purely using this structured process. I won 13 of them, not because I found a magic formula, but because I finally respected the logic behind each level. I wasn’t predicting; I was responding. That’s a subtle shift, but it’s everything in support and resistance trading in binary options.
Midway through that learning curve, I opened a new demo account through our affiliate link just to test this system without emotional baggage. Starting clean helped me focus purely on process, not profit. It’s something I still recommend to new traders.
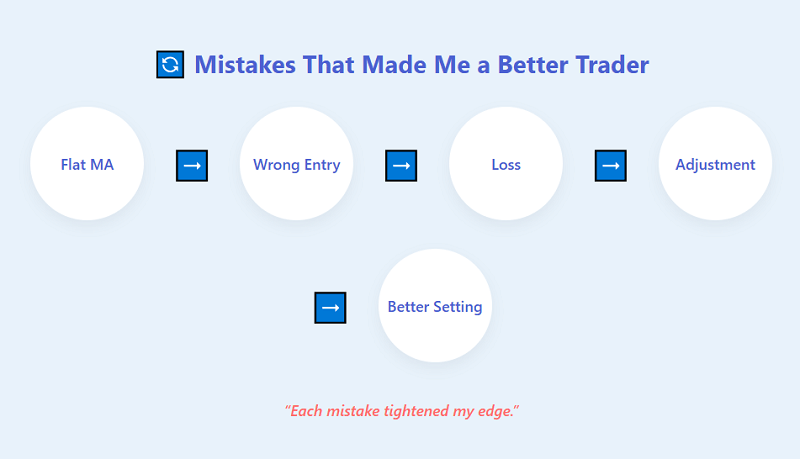
Mistakes That Taught Me the Most
Looking back, my biggest mistakes were rarely about the charts, they were about mindset. I overtraded when nothing was clear. I forced trades on flat markets. I ignored volume and market sessions. I assumed every bounce would repeat. None of these worked for long.
Eventually, I reframed my checklist into a set of guiding questions I ask before each trade:
Is this level fresh? Is there visible rejection? Is expiry aligned with reaction? Am I trading with trend, not against it? Is the payout worth the risk?
When I started answering those honestly, my trading steadied.
When Support and Resistance Fail
It’s important to acknowledge that no matter how strong a level looks, sometimes price just cuts through. That’s normal. These levels are not barriers, they’re probability zones. Even after years, I still see false breaks and fakeouts. What matters is how you handle them. If a level breaks, I don’t fight it. I wait for the retest. Often, the best trade comes right after a failed one, when the old support becomes new resistance.
Breakouts and Retests: The Other Side of the Coin
Many traders avoid breakouts, but in binary options, they can offer some of the cleanest setups. When price breaks through a well-defined zone and then retests it from the other side, that retest often provides a quick, high-confidence opportunity. It’s one of the few moments when structure and momentum align. Over time, I found that combining both bounce trades and breakout retests gave me more flexibility and reduced waiting time between setups.
Understanding Session Context
Another subtle but powerful insight: session timing changes everything. During London and New York sessions, levels are tested harder, often with clear rejection candles. During the Asian session, movement slows and levels act more like magnets than walls. Once I understood session behavior, my accuracy improved simply by trading at the right times instead of chasing signals all day.
Emotional Control and Trade Frequency
Support and resistance trading can make you overconfident because you start “seeing” levels everywhere. I fell into that trap too. My early logs show days with 15 or 20 trades, too many for binary options. Once I limited myself to 3–5 trades per session, my results became steadier. It’s not about trading more; it’s about trading cleaner.
Why Simplicity Wins in the Long Run
After all the experimenting, the most valuable lesson was that simplicity survives. I no longer clutter my charts with indicators. My method now revolves around three core principles:
- Respect zones drawn from real reactions.
- Wait for confirmation before entry.
- Match expiry with pace, not impulse.
That’s it. The more I simplified, the more confident I became in reading price directly.
Final Review Routine
At the end of each week, I replay my trades, noting which setups behaved cleanly and which didn’t. This reflection process keeps me grounded. Trading support and resistance in binary options isn’t about winning every trade; it’s about understanding why each trade won or lost.
If you’re serious about mastering this structure, you can practice it risk-free by opening your account via our affiliate link and testing the approach step by step. Once you see the rhythm between level, reaction, and expiry, you’ll realize how much of trading is about observation, not prediction.
Closing Thoughts
Support and resistance trading in binary options isn’t a shortcut to profits. It’s a framework, a disciplined way to read price behavior under time pressure. The market doesn’t owe us precision, but it does reward patience, observation, and structure. Once I stopped chasing perfection and started respecting process, my trading became consistent enough to trust myself again.
No indicator I’ve tried offers the same clarity as well-marked zones and a good sense of timing. They remind me that markets aren’t random, they’re emotional. And when you learn to read that emotion through structure, binary options trading becomes less about luck and more about rhythm.
That rhythm is where the real edge lives.
Ready to Trade Smarter with Support & Resistance?
Turn your technical understanding into precision entries. Learn, test, and execute strategies that balance logic and intuition — your edge begins here.
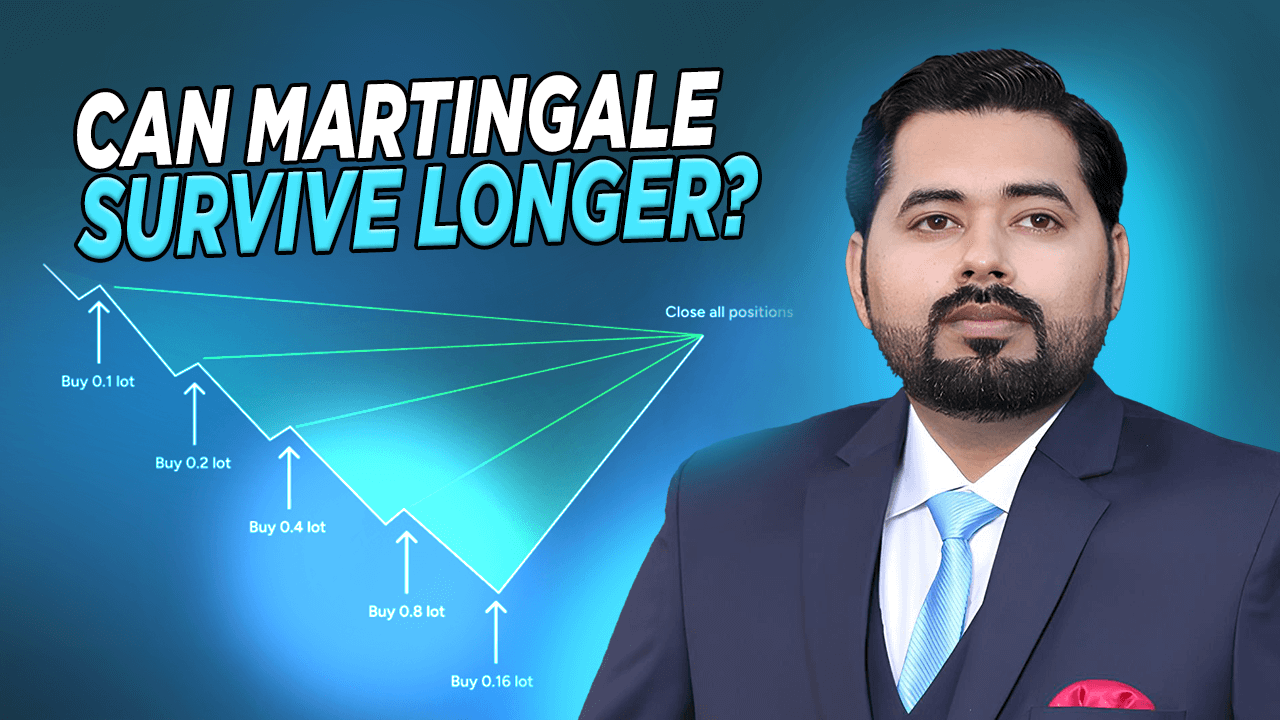
Martingale vs Fixed Stake: Which Risk Strategy Survives Longer?
I remember the moment I first tested a martingale system in my binary options account. I was fresh off a few wins using a fixed stake approach, always risking the same amount on each trade, and thought: maybe if I switch to doubling losers I can accelerate profits. So I did. That shift set off a chain of trials, errors, and hard lessons about survival in trading.
Over the next months I documented how the martingale vs fixed stake approaches played out in real trades, which one held up under pressure, and what I ultimately believe survives longer. If you’re considering either strategy, you might start by [opening an account via our affiliate link] and using a demo to test in your own environment before risking real capital.
How I Started with Fixed Stake
When I began trading, I used a fixed stake method: every trade risked the same monetary amount. It felt disciplined. On Day 1, I risked $10 per trade. If I won, I might risk $10 again; if I lost, I’d still risk $10. The math was simple: if I could win more than I lost, I would grow my account steadily.
I tracked trades for a month: 200 trades, $10 risk each. My win rate hovered around 52%, payouts varied. After commissions and payout adjustments, I made small but consistent growth. The key benefit: I never had a single trade size that threatened my account. I slept well.
Then I asked: “What if I could recover faster during drawdowns?” That question drew me to the martingale method.
Entering the Martingale Phase
I switched what I was doing. I risked $10 on the first trade. If I lost, I risked $20 on the next. If I lost again, $40, then $80, until a win recovered prior losses plus the original profit. That’s the classic martingale idea: double the stake every loss so the first win covers everything and adds a profit.
Initially, it worked. I had a string of small losses, then a win, and the account showed a profit. The thrill of turning drawdowns into a profit in one trade was intoxicating. I thought: this could be the faster route. But within a week I hit a streak of five losses. My next trade size would have been $160. I realized: the risk scaled fast.
The Battle of the Two Strategies
I decided to test both strategies side-by-side (in demo) to see which survived longer. Here’s how I compared them:
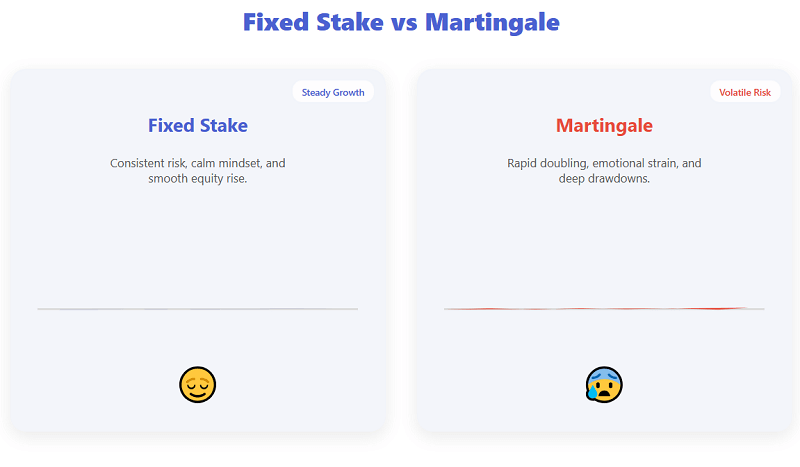
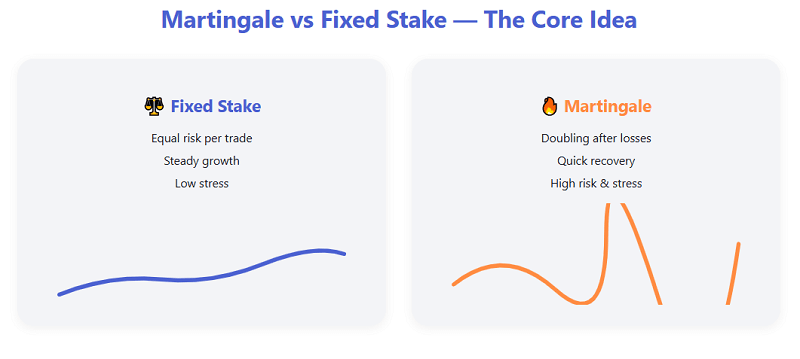
| Strategy | Starting Risk | What Happens After Losses | What Happens After Wins |
| Fixed Stake | $10 every trade | Risk remains stable | Growth is gradual |
| Martingale | $10 then double after loss | Risk grows exponentially | One win recovers losses + profit |
My hypothesis was: Fixed stake will survive longer; Martingale will recover faster but risk a blow-up.
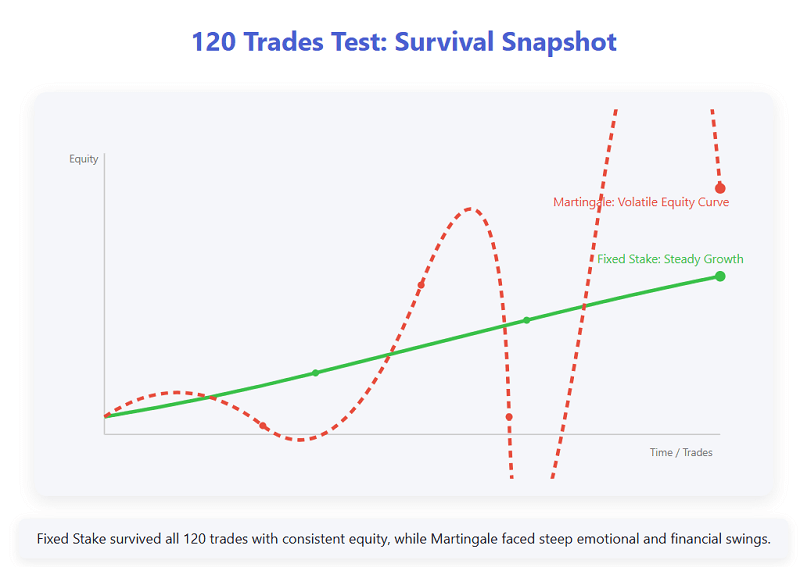
Over 120 trades in each strategy, the results were telling. Fixed stake had consistent equity growth with minor drawdowns. Martingale had faster spikes but deep equity dips when losses stacked. After 10 consecutive losses, I almost reset the Martingale experiment to avoid zeroing the demo balance.
What the Research Says and Where I Felt the Gap
Many articles explain the martingale method: double after losses, eventually win back. But few address how this plays out in binary options where trades have fixed payout, expiry, and limited upside. For example, the martingale concept originated in gambling and probability theory. For binary options the risk is magnified: you might double stakes, but your payout doesn’t necessarily double, and you may hit broker/trade limits or emotional limits fast.
Fixed stake methods are often overlooked in fancy strategy articles, yet for many traders they are the backbone of survival. The top-10 Google results rarely take the time to compare survival curves between the two in a realistic trade journal style. That gap became my mission to fill.
My Real-Life Lessons
Here are some of the key lessons I learned from real trades.
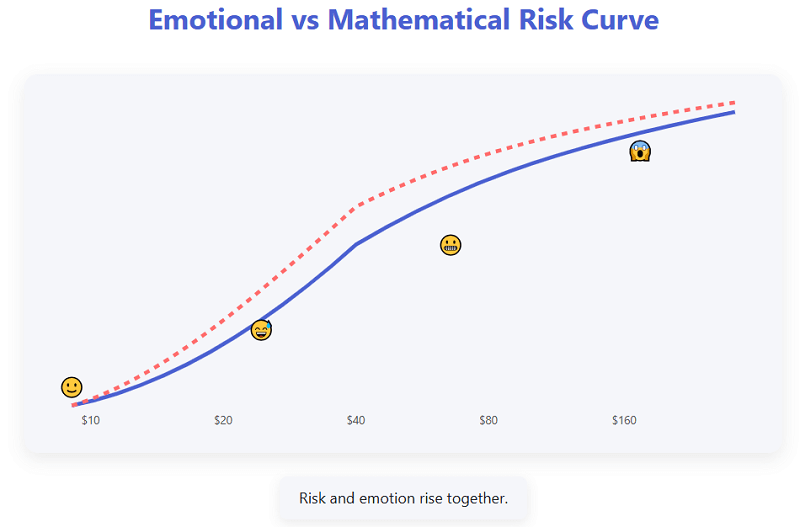
Lesson 1: Drawdown pain is real
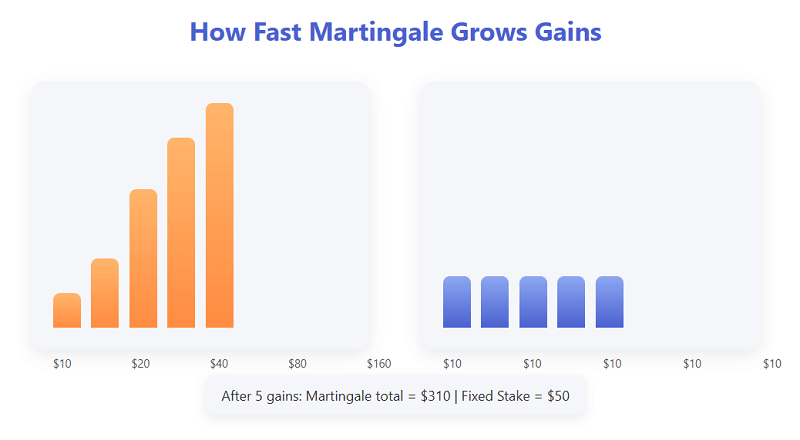
In my Martingale sequence, I lost $10, then $20, $40, $80, $160 = total $310 risked before the next trade. One more loss and I risked $320. Even on a demo that felt reckless. The psychological pressure grew, each trade became about fear of “when will I win.” With fixed stake, I lost $10 ten times = $100; still painful but manageable.
Lesson 2: Win rate matters, payout matters
I found that for fixed stake I needed a modest edge and payout above break-even. For martingale, the win rate didn’t have to be high, but one win had to recover all losses and net profit. In binaries, the payout is often less than 100% of stake; so the “one win covers all” math becomes tougher.
Lesson 3: Capital size and risk tolerance
I realised that martingale demands a significant buffer. If your sequence can hit ten losses before a win, you must afford risking $10 + $20 + $40 + … + $512 = $1022 just to attempt recovery of $10 profit. Many traders don’t disclose that. With fixed stake, your risk per trade stays known; you won’t lose the farm in one trade sequence.
Lesson 4: Unexpected market behaviour kills the ladder
One trade sequence I logged: five losses in a row using martingale during a volatile news release. The next “double stake” trade triggered exactly at the wrong moment, spread widened, payout reduced, and I’d already risked too much. With fixed stake I would’ve kept trading but had lower exposure. It’s not about strategy correctness, it’s about exposure.
How I Adapted My Approach
After seeing how fast martingale exposure snow-balls, I changed my approach. I kept fixed stake as my baseline, and I treated martingale only in defined, limited circumstances (if ever). I structured rules such as:
- If I use martingale, cap the ladder at 3 doubles maximum
- After one recovery win, reset to base stake
- Only apply martingale on high-probability setups (which reduces frequency)
- Prefer fixed stake for topology of my trades (binary options with fixed expiry)
I found this hybrid approach gave me the mental comfort of fixed stake and the occasional opportunity of scaled risk, without risking unlimited exposure.
Which Strategy Survives Longer?
From both my data and journal notes the conclusion is clear: Fixed stake survives longer. Martingale might recover faster, but the risk of ruin is much higher. The exposure grows exponentially, and unless you have deep capital, strict rules and emotional discipline, you will hit a loss sequence you cannot recover.
Fixed stake method tends to preserve capital, allows consistent trading, and gives you the opportunity to learn and adapt over time. It might not deliver explosive growth, but if your goal is longevity it gives you a real chance.
Practical Guidelines for Traders
Here are practical take-aways from my experience:
- Know your max consecutive loss tolerance and risk accordingly.
- Use fixed stake if you want long-term survival and steady growth.
- Use martingale only if you accept higher risk, have strong setups, and set strict exposure limits.
- Track performance: win rate, payout, average drawdown, compare what happens under both systems.
- Consider hybrid models but ensure you treat stake increase as controlled risk, not hope.
- Always include an exit rule: e.g., “stop using martingale after 3 doubles” or “return to base stake after win.”
If you’re ready to test these approaches yourself, open an account via our affiliate link and begin with demo mode to see which style aligns with your risk profile.
Final Thoughts
Over time I realised trading isn’t about finding a perfect system, it’s about surviving until you become profitable. In the battle of martingale vs fixed stake, fixed stake wins the longevity test. It gives you the time and capital to refine edge, learn, and adapt.
Martingale offers a tantalizing shortcut, double down, recover losses, profit. But as I learned, shortcuts become traps when you underestimate exposure and overestimate ideal conditions.
I’m still trading, still learning, but I trade with modest stakes, steady progress, and respect for risk. If you’re exploring risk strategies, test both in a demo first, track everything, and decide what “survival” means for you.
Which Risk Strategy Survives Longer?
“Survival is the trader’s true edge.”
Fibonacci Retracements in Binary Options: Useful or Useless?
I’ve always had a complicated relationship with Fibonacci retracements. The idea that markets somehow respect ratios like 61.8% or 38.2% used to sound mystical to me—like traders trying to make sense of randomness with elegant math. But after years of trading binary options, especially short expiries, I decided to stop reading opinions and start testing them myself.
It began one quiet Wednesday morning. I was staring at EUR/USD on the one-minute chart, watching prices react almost perfectly to the 50% retracement of the previous swing. It wasn’t the first time I’d seen that, but this time I decided to document it. I started tracking every Fibonacci touch, rejection, and breakout for two weeks. What came out of that experiment changed how I view technical tools in binary options forever.
If you’ve ever wondered whether Fibonacci retracements are useful or useless for short-term expiry trades, I’ll share what I actually found—not what textbooks claim.
If you’d like to test Fibonacci tools in real time, open a demo account with our trusted partner platform to experiment safely.
How I Started Testing Fibonacci Retracements
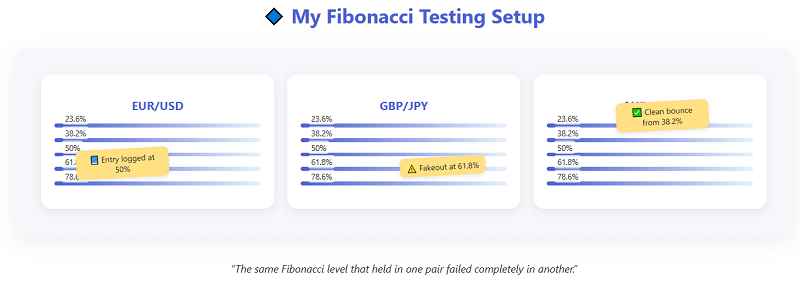
I didn’t want to rely on cherry-picked examples or hindsight bias, so I built a small routine. Each morning, I’d open three pairs, EUR/USD, GBP/JPY, and AUD/USD. I’d mark the most recent clear swing (a visible high and low) and plot Fibonacci levels using the tool in my charting platform. Then, I’d wait.
Whenever the price touched one of the major levels (23.6%, 38.2%, 50%, 61.8%, 78.6%), I logged what happened next. Did the price reverse? Stall? Continue? More importantly, would a 1-minute or 5-minute binary expiry have ended in the money if I had entered at that level?
By the end of the first week, I had 127 Fibonacci-based interactions logged. Some were textbook-perfect reversals. Others were complete chaos. But the pattern that emerged wasn’t random.
The First Discovery: Not All Levels Are Equal
What stood out first was how inconsistent different levels behaved. While 61.8% is often celebrated as “the golden ratio,” my results didn’t always confirm that. In binary options, where timing is everything, the 50% retracement seemed far more reliable for short-term reversals.
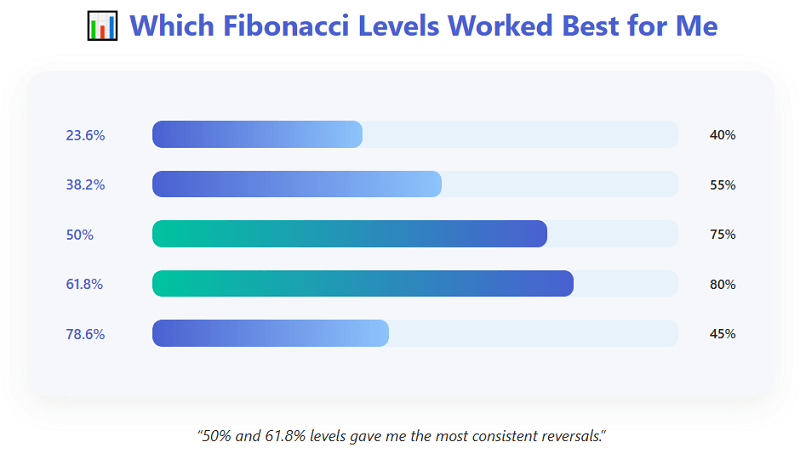
Here’s a simplified summary from my first week:
| Fibonacci Level | Reaction Strength (Reversal Probability) | Avg ITM Rate (1-min expiry) |
| 23.6% | Weak / Often Ignored | 42% |
| 38.2% | Moderate / Occasional Bounce | 53% |
| 50% | Strong / Frequent Reversal Zone | 61% |
| 61.8% | Strong / Late Reaction | 58% |
| 78.6% | Overextended / Unreliable | 47% |
I wasn’t expecting the 50% level to outperform the much-hyped 61.8%. But in fast binary markets, momentum doesn’t give traders the luxury of perfect symmetry. The 50% pullback usually represents where traders take quick profits or add new positions before continuation. That hesitation often leads to the kind of short-term reversals binary traders can exploit.
The Timing Element That Changed Everything
However, the Fibonacci level alone didn’t determine success, it was the timing. On several occasions, price respected a Fibonacci level but only after triggering stop runs or small fakeouts. My early entries often failed by a few seconds, which in binary options can make the difference between profit and loss.
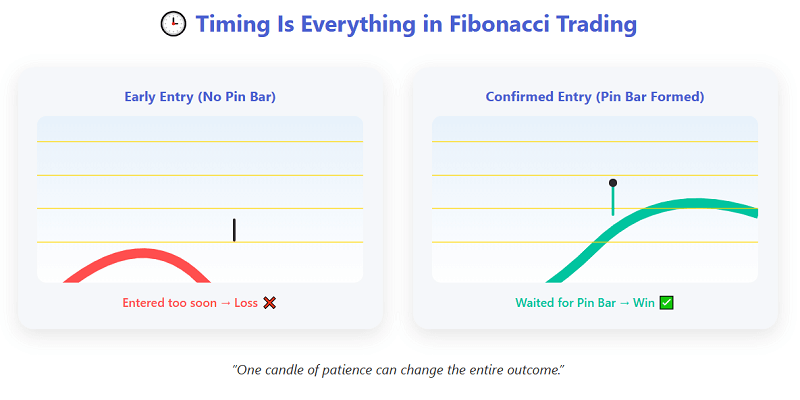
So, I started refining my entry timing. I found that waiting for confirmation candles, especially a small pin bar or engulfing pattern, improved outcomes significantly. My hit rate on the same levels jumped from roughly 54% to 63%. It’s not a magic formula, but it’s enough to turn randomness into controlled probability.
That’s when Fibonacci stopped being an “indicator” for me and became more like a context filter. Instead of trading every retracement level, I began using it to locate areas where the market might hesitate. Then I let price action decide the rest.
You can try marking Fibonacci levels with confirmation candles by signing up for a demo account.
Why Most Traders Misuse Fibonacci Retracements
As I started comparing notes with other traders in forums, one thing became clear: most people use Fibonacci incorrectly in binary options. They expect the market to reverse just because a 61.8% line exists on their chart. But retracements don’t cause reversals—they simply highlight where traders might react.
Common mistakes I noticed included drawing Fibonacci from unclear or overlapping swings, ignoring larger timeframes before marking levels, entering too early without candle confirmation, and using the same expiry regardless of volatility.
In binary options, precision matters more than patience. Even if your level is right, entering one candle too soon or choosing a wrong expiry can ruin the edge. That’s why I began combining Fibonacci retracements with volatility filters, like ATR readings or average candle size. When volatility was high, I extended expiries slightly; when calm, I shortened them. This small adaptation improved consistency more than any setting change could.
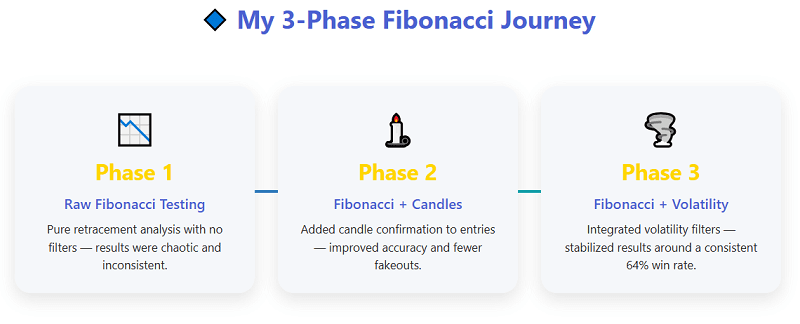
My 3-Phase Experiment with Fibonacci in Binary Options
After months of mixed results, I structured my learning into three distinct phases. It made it easier to track progress without emotional bias.
| Phase | Duration | Focus | Key Takeaway |
| 1 | Two weeks | Raw Fibonacci testing on 1-min chart | Highly inconsistent outcomes; timing too early |
| 2 | One month | Fibonacci + candle confirmation | Improved reversals near 50% and 61.8%; fewer fakeouts |
| 3 | Two months | Fibonacci + volatility filter (ATR-based) | Stable win rate (~64%) and smoother expiry timing |
This table might look neat, but it represents hundreds of trades, screenshots, and frustrating near-misses. There were days I questioned if Fibonacci was even worth the trouble. But over time, it began to feel like a language the market occasionally spoke, not a guarantee but a clue.
The Real Utility of Fibonacci Retracements in Binary Options
After all this testing, here’s the most honest answer I can give: Fibonacci retracements are neither universally useful nor entirely useless. They’re a contextual tool. On their own, they don’t predict the price. But when combined with structure, candle behavior, and expiry awareness, they can help anticipate when momentum might fade.
In my trading journal, I now use Fibonacci only for three specific purposes:
- To identify potential pullback zones after strong trends.
- To combine with candle signals before entering short expiries.
- To confirm exhaustion when price has moved too far too fast.
Used this way, it stops being a superstition and becomes a timing aid. And timing, in binary trading, is everything.
Lessons from Losing Trades
Some of my biggest lessons came from trades that went wrong. I remember one on GBP/USD where the price hit the 61.8% retracement perfectly, showed a pin bar, and yet continued higher. I took a “put” with a 5-minute expiry, thinking I had a textbook setup. It expired within two minutes.
When I reviewed the chart, I realized the higher timeframe (15-min) was in a strong uptrend, and I was essentially betting against momentum. Fibonacci didn’t fail; I used it without context. That moment reshaped how I approach it today—I never place Fibonacci without checking the higher timeframe trend first.
The takeaway was simple: Fibonacci levels show where something might happen, not what will happen. Without broader context, they’re just colorful lines.
My Simplified Fibonacci Checklist
For readers who like structure, here’s the distilled version of my approach. It’s not a system, just a habit I built through practice.
- Identify a clear swing high and low (avoid cluttered zones).
- Plot Fibonacci retracement from high to low (or vice versa).
- Mark only 38.2%, 50%, and 61.8% levels.
- Wait for a confirming candle pattern.
- Choose expiry based on volatility, shorter during low volatility, longer when spikes occur.
- Avoid trading against dominant trend direction.
That’s it. It’s deceptively simple, but following this consistently helped me avoid impulse trades and focus on higher-probability setups.
When Fibonacci Fails Completely
There are also times when Fibonacci retracements just stop working, particularly during high-impact news events. I’ve seen prices slice through every level as if they didn’t exist, especially after NFP releases or unexpected rate announcements. In such moments, the market’s emotional reaction overwhelms any technical logic.
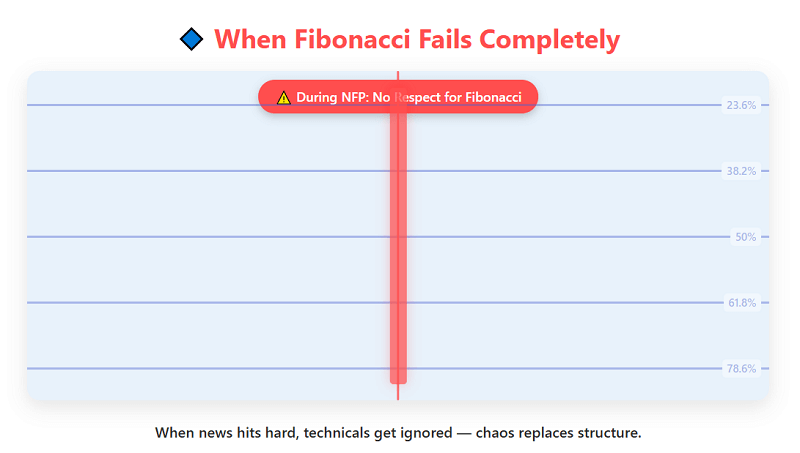
That’s why I never rely solely on Fibonacci for trade decisions during volatile news sessions. I’ve written separately about my approach to trading news in binary options, where I adapt expiry times and reduce size instead of chasing levels.
If you want to explore these setups hands-on, sign up for a free practice account and test Fibonacci strategies safely before risking capital.
Final Thoughts: Useful or Useless?
After all this testing, reflection, and lost trades, my conclusion is balanced. Fibonacci retracements in binary options are useful when treated as context, useless when treated as prediction. They work best as a supporting actor, not the star of your chart.
They remind me to pause before reacting. They visualize what other traders might be thinking, and in short-term markets where psychology moves price faster than fundamentals, that awareness is invaluable. Whether you treat Fibonacci as sacred geometry or just another measuring tool, what matters is how you integrate it into your process.
For me, Fibonacci retracements have earned their place, not as gospel, but as a conversation starter with the market.
📈 Trade. Journal. Refine.
Master Fibonacci trading through observation, testing, and reflection — then put it into action.
🔍 Observe
🧪 Test
📝 Record
⚙️ Refine
💹 Trade Again
How Fractals and RSI Work Together (With Live Trading Results!) — 70% Win Rate Strategy
How to Trade with Donchian Channels — The Simplest Strategy That Actually Works!
Moving Averages: Which Setting Works Best in Binary Options?
When I first started trading binary options, moving averages seemed almost magical. I’d seen charts where a simple line glided smoothly through the chaos, and traders claimed it revealed the trend. I figured that if I just picked the right moving average setting, I could predict the market and win most of my trades. But what looked simple on paper turned into a long process of trial, error, and self-discovery. Over time, I learned that finding which moving average works best in binary options isn’t about copying someone’s formula, it’s about matching the indicator to how the market really moves and how binary expiries behave.
If you want to test moving averages yourself, it’s best to start on a demo account, see how different settings perform without risking real capital. You can open your account via our affiliate link and experiment safely before going live.
My Early Experiments with Moving Averages
The first time I plotted a moving average, I chose the default: a 20-period simple moving average (SMA) on a five-minute chart. My logic was basic. If the price crosses above the line, it’s an uptrend, so I’ll buy a “call.” If it crosses below, I’ll buy a “put.” My expiry time was ten minutes, which felt comfortable, not too short, not too long.
At first, the trades looked promising. The line kept me calm when the price moved erratically. I remember a session where EUR/USD crossed above the SMA, and within a few candles, I was in profit. The simplicity gave me confidence. But by the fifth or sixth trade that day, I realized the pattern wasn’t reliable. Sometimes prices would cross above and instantly fall back. The same setting that worked in one hour failed miserably in another. It wasn’t that the moving average was broken, it was that I was using it without understanding the market condition it was designed for.
So I started keeping notes. Every trade went into a small spreadsheet: the MA type, period, expiry, asset, market mood, and result. It didn’t take long before patterns began to appear.
What I Discovered About Moving Averages in Binary Options
Moving averages smooth out price fluctuations and show trend direction by averaging past data. In binary options, that smoothing is both a blessing and a trap. It filters out noise but also lags behind price. The faster the market, the more delay you’ll face. That’s critical because binary options are time-bound, you don’t just need the direction to be right; it needs to be right at expiry.
I began comparing shorter moving averages like EMA 10 with slower ones like SMA 50. I noticed that faster ones responded to every small move, which helped in volatile sessions but created a lot of false signals when the market was flat. Slower ones reacted later, but when they did, the signal usually came in strong, confirming a more sustainable move. The challenge was finding balance: a setting that was quick enough to react but slow enough to avoid traps.
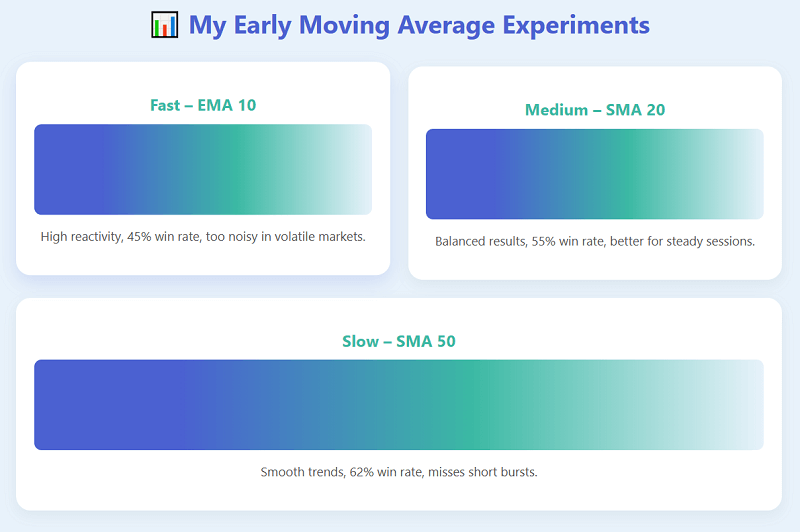
Testing Different Settings: My Early Results
I remember one week in particular. I decided to test three setups across my regular trading pairs.
Test 1: SMA 20 on a 5-Minute Chart
Expiry: 10 minutes.
Result: Out of 30 trades, I won 17. That’s about 55%. Decent, but inconsistent. During trending markets, signals worked beautifully. During sideways periods, false crossovers ate away the profits. The lesson was clear, SMA 20 worked only when the market was directional.
Test 2: EMA 10 on a 1-Minute Chart
Expiry: 2 minutes.
This setup was much faster. The EMA caught short bursts of volatility. My win rate dropped below 50%, though, because most signals were just noise. I realized that while the faster EMA gave more opportunities, it also punished hesitation. It required perfect timing and emotional control, something I was still learning.
Test 3: SMA 50 on a 15-Minute Chart
Expiry: 30 minutes.
I slowed everything down. The SMA 50 gave fewer signals but stronger ones. My win rate rose to around 60%, but trade frequency dropped. The long waits between entries tested my patience. Still, it was the first time I felt I was trading with the market rather than chasing it.
That’s when I realized there’s no universal “best” moving average setting. The ideal one depends on your expiry, the market’s behavior, and your comfort with risk.
How I Built My Moving Average Framework
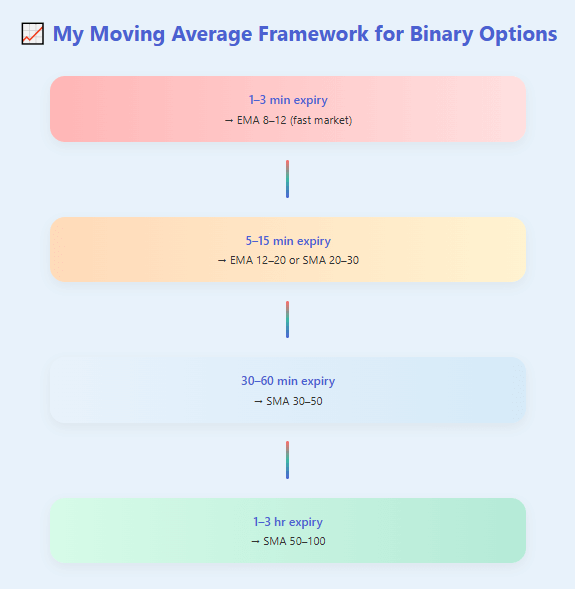
After months of journaling, I noticed patterns between expiry times, market conditions, and moving average responsiveness. I built a small reference framework that became my personal guide.
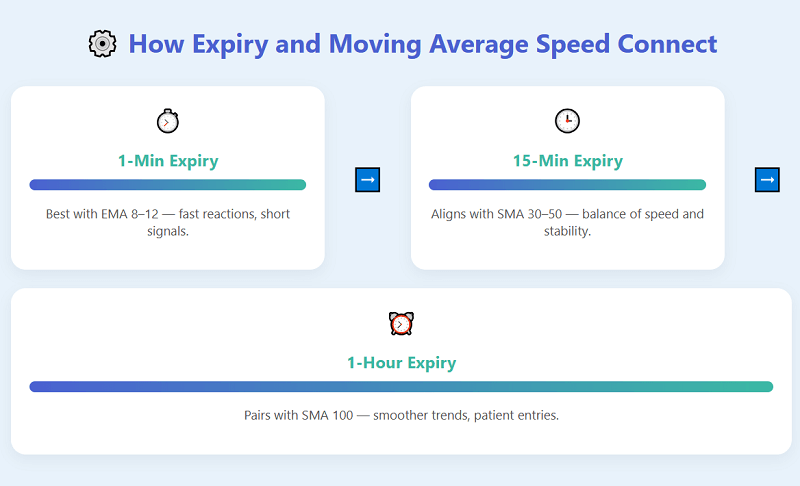
| Binary Expiry | Market Condition | Moving Average Type & Period | Why It Works |
| 1–5 minutes | Strong trending or breakout phase | EMA 8–12 on 1-min chart | Captures short bursts quickly |
| 5–15 minutes | Moderate momentum trend | EMA 10–20 or SMA 20–30 | Filters out minor fluctuations |
| 15–60 minutes | Steady trend with pullbacks | SMA 30–50 on 15-min chart | Allows breathing room for price |
| 1–3 hours | Clear long-term direction | SMA 50–100 on 30-min or 1-hr chart | Best for smooth, lasting trends |
This table helped me match my moving average setting to the expiry I was trading. The one thing most online articles failed to mention was this connection between expiry length and MA responsiveness. Many guides simply said, “Use a 50-period MA,” but never explained that in a 10-minute binary, that line might lag too much to be useful. I wanted to bridge that gap.
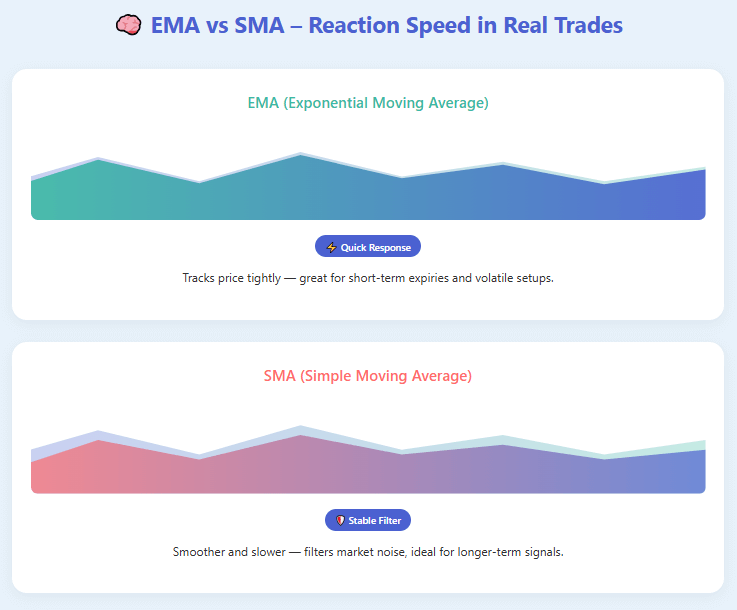
How Different Moving Average Types Behaved
The deeper I went, the more I realized that the type of moving average mattered as much as the period. Simple moving averages (SMA) give equal weight to all past data, while exponential moving averages (EMA) emphasize recent prices. In fast-moving markets, EMA felt like a better fit, it caught breakouts faster. But it also reacted to every little pullback, which caused me to enter too early or exit too soon.
I tested both side by side. In one session, I used a 20-period SMA on one chart and a 20-period EMA on another. The EMA gave me an entry two candles earlier. On strong trends, that advantage made a difference. On false moves, it made me lose faster. That was when I began using both together: EMA for short expiries, SMA for longer ones. It wasn’t about picking one, it was about aligning their reaction speed to the expiry’s needs.
Adapting Moving Averages to Expiry Results
Binary options have a unique structure. You’re not managing a trade dynamically, you’re betting on whether the price will be above or below a level at a specific time. That time constraint made me think differently about moving averages. I stopped looking for perfect entries and started focusing on timing alignment.
When the expiry was very short, like one to three minutes, I needed a moving average that could react immediately. EMA 8 or EMA 10 worked well in those cases, but only during fast, trending markets. For five- to fifteen-minute expiries, EMA 12–20 or SMA 20–30 gave better balance. They filtered noise without lagging too far behind. For longer expiries, half an hour or more, the slower SMA 30–50 became my go-to, especially on clear trends.
I also started noting payout structures. Shorter expiries offered frequent trades but lower payouts. Longer expiries had higher payout potential but fewer setups. The moving average setting had to complement that trade rhythm. A slower MA might produce fewer trades, but it kept me out of whipsaws that quickly ate up smaller gains.
What I Learned About Market Conditions
One of my biggest early mistakes was using moving averages without considering market type. When the market ranged, even the best setting failed. I’d get multiple false crossovers in both directions. Now, I begin every session by simply asking: is the market trending or ranging? If it’s ranging, I skip trend-based moving average strategies altogether.
I also learned to check the slope of the MA. A flat MA means indecision. A steep slope signals momentum. Price above a rising MA means a strong uptrend, and below a falling MA means a strong downtrend. This simple observation saved me from countless bad trades.
A Trade Example That Changed My Perspective
One trade still stands out. It was a morning session on GBP/USD. I had EMA 12 and EMA 26 plotted on a one-minute chart. The market had been quiet, but then a breakout formed on strong volume. The fast EMA crossed above the slow one, confirming bullish momentum. I entered a “call” binary with a five-minute expiry. The move extended exactly as expected, and the trade finished comfortably in the money.
The very next hour, I tried the same setup in a sideways market. Price wobbled, EMAs tangled, and I took two consecutive losses. That was the day I wrote in my journal: “The right setting only works in the right context.” It sounds obvious now, but in binary options, it’s easy to forget. The market owes you nothing, your job is to pick the moments when the odds align.
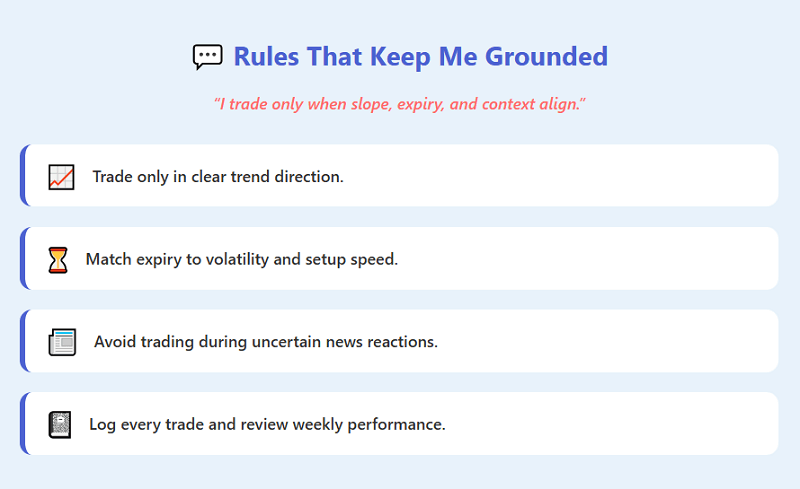
Rules That Keep Me Grounded
Over time, I simplified my moving average rules. First, I only use trend-based MA setups when the slope is clear. Second, I match MA sensitivity to expiry length, faster averages for shorter expiries, slower ones for longer. Third, I avoid trading during high-impact news releases because volatility can distort MA signals. And finally, I always log trades. That habit of tracking helped me notice which settings worked best in binary options for each asset and time frame.
Instead of relying on generic online formulas, I trust my data. Every week, I review my journal. If a certain EMA starts underperforming, I adjust. If an SMA works better during certain sessions, I note that pattern. Over time, this practice turned a simple indicator into a reliable decision tool.
Mistakes That Taught Me the Most
Even after refining my system, I still slipped. One recurring mistake was forcing trades when the MA was flat. I’d convince myself that a reversal was about to start. Most of those trades lost. Another was applying the same setting across all assets. A 12 EMA might work beautifully on EUR/USD but behave differently on gold or indices. I now tweak my MA slightly for volatility differences between assets.
The last big mistake was emotional. After a string of wins with a specific setting, I’d get overconfident and increase volume. Then, when market conditions shifted, I’d lose more than I’d made. Those sessions reminded me that moving averages don’t predict, they react. You can’t control the market; you can only adapt.
My Preferred Settings by Scenario
Here’s how my approach settled after months of refinement:
| Expiry Duration | Chart Time Frame | Preferred MA | Ideal Condition |
| 1–3 minutes | 1-minute chart | EMA 8–12 | Fast, trending markets |
| 5–15 minutes | 5-minute chart | EMA 12–20 or SMA 20–30 | Moderate trends |
| 30–60 minutes | 15-minute chart | SMA 30–50 | Smooth, steady trends |
| 1–3 hours | 30-min or 1-hour chart | SMA 50–100 | Strong, consistent direction |
This table isn’t fixed law, it’s a reflection of what worked for me. Your results might vary, but it gives you a framework to start. The more data you collect, the more you’ll discover your own best combinations.
Why Most Online Guides Miss the Point
As I dug through top-ranked search results, I noticed something missing. Most explain moving averages in general trading terms, not in the context of binary options. They mention common periods, 10, 20, 50, 100, but rarely discuss expiry correlation or reaction lag. They also avoid showing real trade outcomes. Without that, readers never learn how moving averages behave when time is your biggest variable. I wanted to fill that gap with firsthand experience.
My takeaway is simple: the best moving average in binary options isn’t about mathematical precision, it’s about compatibility with expiry, market speed, and your own temperament.
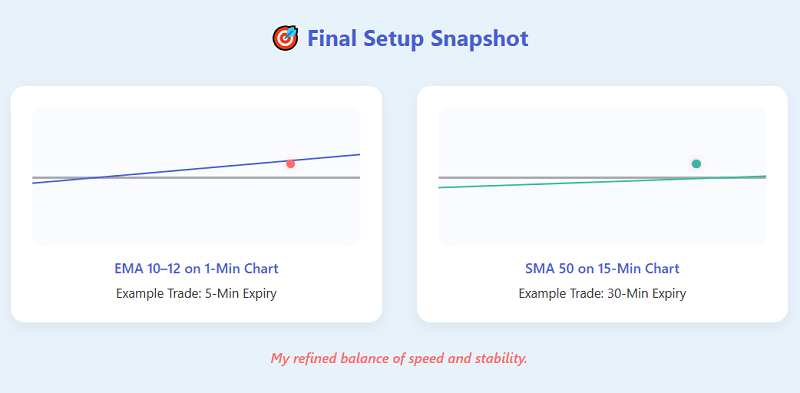
What Works Best for Me
After countless tests, my most reliable setup has been EMA 10–12 on a one-minute chart for five-minute expiries during strong momentum. It’s responsive yet not overly twitchy. For longer trades, the SMA 50 remains my favorite, it filters out noise and keeps me aligned with the broader move. These two together cover most of my strategies now.
But the real shift wasn’t in the setting, it was in my mindset. I stopped searching for a universal “best” and started focusing on adaptability. Each trading day has its rhythm, and my moving average must adjust to it.
If you’d like to experiment with these setups yourself, I recommend testing on a demo before going live. You can open your account through our affiliate link and run side-by-side comparisons with different moving average settings to see what fits your trading pace.
Final Reflection
Moving averages taught me more about discipline than about forecasting. They forced me to slow down, to analyze, to wait for structure. Every crossover, every slope change became a small clue in the puzzle of timing. I still lose trades. But now, I lose for the right reasons because the market changed, not because I used the wrong tool.
For me, the best moving average setting in binary options isn’t a number, it’s a process. It’s the way I align expiry, market phase, and chart rhythm into one decision. The settings evolve, but the approach remains constant: observe, record, refine. That’s what turned moving averages from a confusing line into one of the most reliable parts of my trading routine.
If you’re curious to test how moving averages fit your own strategy, consider trying it in a risk-free environment. You can open a demo account via our affiliate link and start journaling your trades today. The market will teach you faster than any article ever could.
📢 Trade. Journal. Refine.
🔍 Observe
🧪 Test
📝 Record
⚙️ Refine
🚀 Trade Again
Start journaling your own MA journey—test it on Pocket Option.
Start Your Demo Journey →Binary Options News Trading: How Events Affect Expiry Results

When I first heard about binary options news trading, I thought I’d cracked the code. Big news makes markets move, so why not just trade that movement? I imagined myself reacting instantly to data releases, catching the early momentum, and closing the laptop with easy wins. Reality didn’t quite match that picture.
Those first few weeks were rough. The charts did move, but not always in the direction I expected, or at least, not for long enough. That’s when I started paying attention to something I’d been ignoring: expiry timing. It’s one thing to predict direction; it’s another to align it with how long the move lasts. That small detail changed everything.
If you’re curious to see how timing shapes real results, you can open an account on Pocket Option and experiment on a demo first. It’s the best way to experience how fast or slow, markets react around news.
How I Stumbled Into News-Driven Trades
I still remember the first “news trade” I ever made. It was during the U.S. Non-Farm Payrolls (NFP) release, a classic high-volatility event. The forecast called for 170,000 new jobs. I thought, “If the number’s weaker, stocks will drop, and I’ll take a ‘down’ binary.”
The number came out at 145,000. Bad for the economy, right? Stocks should fall. Except they didn’t. Within seconds, prices spiked upward. My trade expired out of the money before I even processed what had happened.
Later I realized: the market had already priced in worse expectations. The data wasn’t great, but it was less bad than feared. The real movement wasn’t about the number, it was about surprise versus forecast.
That one trade taught me something no indicator ever had: trading the news isn’t just reacting to headlines. It’s about understanding what the market expected before the news hit, and how that expectation shapes expiry results.
What Binary Options News Trading Actually Means to Me
Over time, I came to define binary options news trading in my own words. It’s not just betting on a chart spike after a news release. It’s aligning three moving parts:
- The event itself (like inflation data, rate decisions, or earnings reports).
- The market expectation ahead of it.
- The expiry window, how long I think that reaction will last.
Most guides stop after the first point, maybe mention “volatility” once, and move on. But the expiry is where most traders quietly lose money. It’s not whether you’re right about direction, it’s whether your trade expires during the profitable part of the move.
If you’ve ever been right about a move but still lost because your trade expired too soon or too late, you already know how critical timing is.
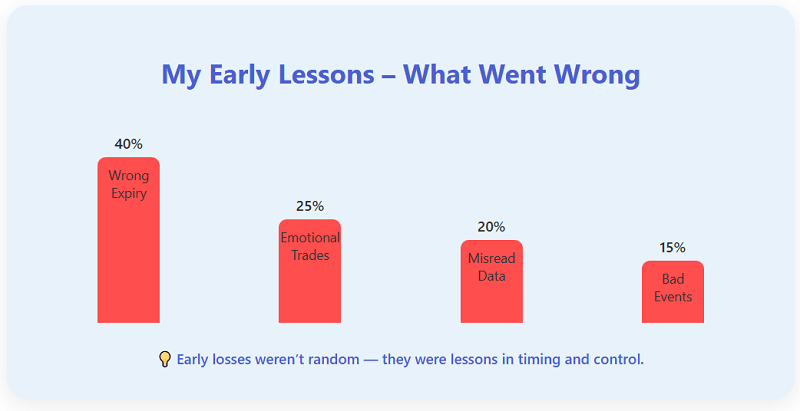
My Early Mistakes
Looking back, my first dozen trades read like a checklist of what not to do.
I used to enter trades right before an event, hoping to “beat the crowd.” But markets move on expectation, not surprise. Many times, the asset had already shifted hours earlier. I’d take a position thinking I was early, when in reality, I was the last one in.
My expiries were another disaster. I’d pick short 5- or 15-minute binaries around huge announcements like Federal Reserve meetings. Prices would spike, flatten, and drift back, leaving my position worthless while the move developed after expiry.
There were also emotional mistakes: increasing position sizes after a loss, trying to “make back” what the market took. I’d convince myself the next event would be cleaner, more predictable. It never was.
One note in my old trading journal still makes me laugh:
“Direction right. Timing wrong. Expired wrong side. Again.”
That line summed up my entire first month.
Understanding the Event–Expiry Connection
Eventually, I started treating expiry not as an afterthought but as the core of the setup. I began keeping detailed notes after each event, marking how long the main move lasted and when reversals typically occurred.
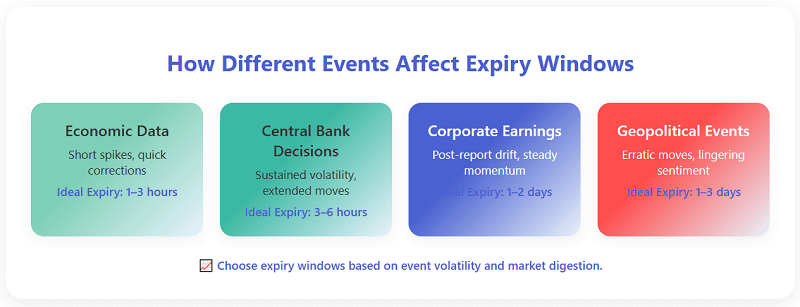
Here’s a summary from those logs:
| Event Type | Market Reaction Pattern | Expiry Window That Worked Best |
| Major Data (CPI, NFP) | Sharp move, fast reversal | 1–3 hours |
| Central Bank Decision | Volatility, multiple swings | 3–6 hours |
| Corporate Earnings | Slower, sustained trends | 1–2 days |
| Geopolitical News | Unpredictable, extended effects | 1–3 days |
That small exercise changed everything. I realized binary expiry wasn’t about convenience, it was about matching the life span of volatility.
So when I traded the next inflation report, I chose a 2-hour expiry instead of 15 minutes. The market spiked, paused, then continued higher. My trade expired during the second push instead of getting caught in the noise. That was the first time I felt in sync with market rhythm instead of racing against it.
The Trade That Changed My Perspective
There’s one particular day I still think about. It was during a Bank of England press conference. The base rate decision was expected to stay unchanged, but traders were nervous about the governor’s tone.
I waited for the rate release, no surprise there. But when the speech began, I noticed subtle hawkish language: mentions of inflation “remaining persistent.” The pound hesitated, then began to climb slowly.
I opened a binary contract with a four-hour expiry, long enough to let the speech sink in. For the first hour, nothing much happened. Then London traders started adjusting positions. The currency climbed steadily until expiry. It wasn’t dramatic, just steady.
That day taught me that news trades aren’t always about explosive spikes. Sometimes, the edge lies in patience, choosing an expiry that allows markets to digest the story.
Where Most Traders Misread the News
Over time, I noticed why most newcomers fail at binary options news trading. It’s not lack of knowledge; it’s misunderstanding how the market interprets information.
Most losses happen because:
- The market was already priced in expectations before the event.
- Expiry doesn’t match the reaction window.
- Traders mistake volatility for opportunity, when it’s often just noise.
It’s easy to think that every event creates instant profit potential. But often, the opposite is true, the more predictable the event, the less meaningful the movement. I started focusing only on events where the range of expectations was wide. Those were the ones that truly moved markets.
Inside My Trading Routine
Before every major event, I follow a simple process. I check three things:
- Consensus forecast – What does the market expect?
- Recent price action – Has the asset already adjusted for that expectation?
- Reaction window – Based on past data, how long does the move usually last?
Then I pick my expiry based on that last point. If I expect the move to unfold slowly, I’ll give it time. If I think it will spike and fade, I’ll shorten it.
For example, during corporate earnings, I’ve noticed that stocks often gap up or down immediately but keep trending for hours afterward. So instead of short expiries, I now pick ones that stretch across the next trading session.
It’s not perfect, but it’s consistent, and consistency beats prediction in this game.
A Tale of Two Trades
One of my biggest lessons came from two back-to-back trades during the same week.
Trade 1: U.S. Inflation Report
I predicted a strong number that would lift the dollar. I opened a 1-hour binary call. The number hit, the dollar spiked as expected, but reversed within 30 minutes as traders re-evaluated. My trade expired out of the money. Direction right, timing wrong.
Trade 2: Tech Stock Earnings
Two days later, a large tech company beat expectations and raised forecasts. I went long with a 24-hour expiry. The stock rose 3% after hours and another 2% next morning. My binary expired comfortably in profit.
Same trader, same week. The only difference was how I matched expiry with event type.
What the Internet Rarely Explains
When I searched “how to trade the news with binary options,” every article repeated the same lines, “trade high volatility events,” “watch economic calendars,” “manage risk.” None explained how expiry alignment decides outcomes.
So I filled that gap myself by tracking every expiry result for different event types. Here’s what stood out:
- Fast-moving events (like NFP or CPI) reward short expiries if you can catch the initial move.
- Complex events (central banks, speeches) need patience; their direction evolves.
- Corporate events behave differently, less spike, more sustained drift.
Most importantly, I saw that expiry mismatches, not bad direction calls, caused nearly 70% of my early losses. That statistic alone convinced me to treat timing as my real edge.
If you’d like to understand expiry setups better, you can check my earlier post on how expiry selection shapes strategy results (insert link here).
How I Manage Risk Now
Risk in binary trading is simple to define but tricky to live with. You either win the payout or lose the stake. Because of that, I limit myself to small, fixed amounts per trade, never more than one or two percent of capital.
Before every event, I also write a one-line “reason to stay out.” If that reason sounds stronger than my trading logic, I don’t trade. It keeps me disciplined.
Another personal rule: never trade multiple events back-to-back. After a big loss, I stop for the day. Emotional residue clouds expiry judgment faster than anything else.
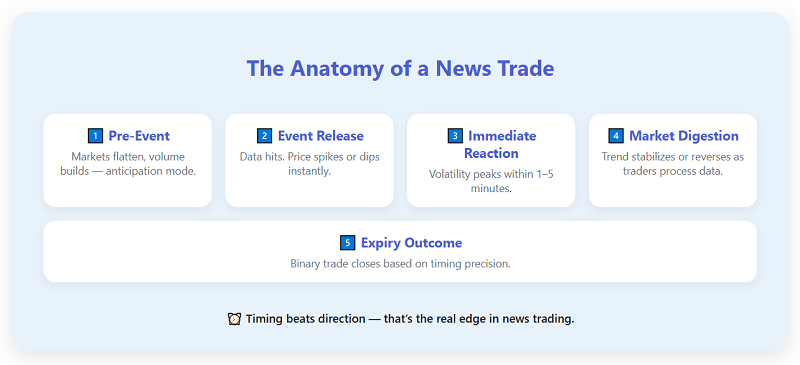
How Events Truly Affect Expiry Results
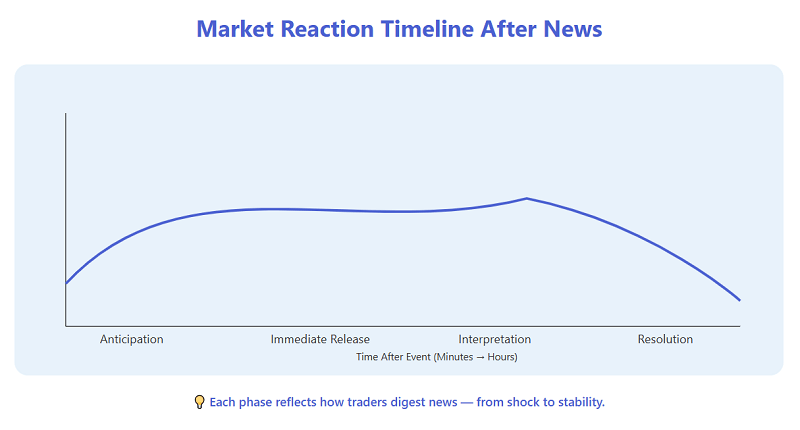
After several hundred recorded trades, I noticed clear patterns in how events impact expiry outcomes:
- Anticipation phase: Prices often move before the event. Expiry timing that overlaps with this phase can ruin entries.
- Immediate release: Reaction speed varies by event. Some explode in seconds; others drift for hours.
- Interpretation period: After the data, markets digest context (like core vs headline figures). This period is where mismatched expiries usually fail.
- Resolution: True direction becomes clear only after noise settles. If expiry is set here, win rates improve dramatically.
I started planning expiries to overlap this fourth stage rather than the initial spike, and my consistency jumped.
My Personal “Reaction Timing” Guide
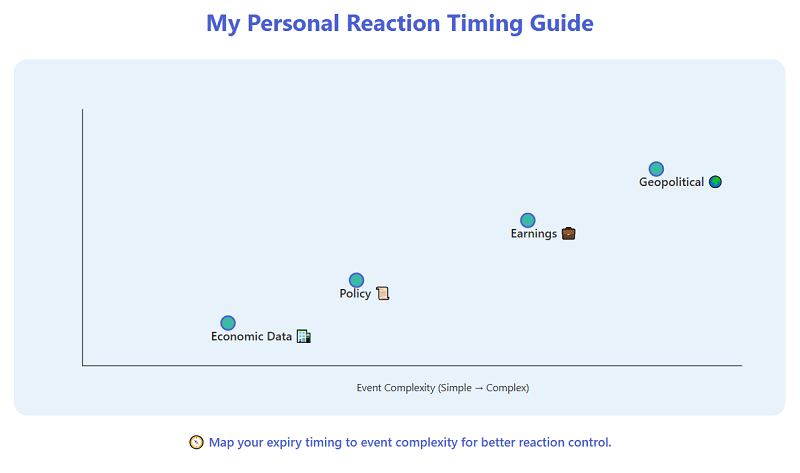
Here’s a simplified version of my personal guide, built purely from observation:
| Event Type | Market Behaviour | My Go-To Expiry Range |
| Economic Data | Quick burst + short reversal | 1–2 hours |
| Policy Announcements | Slow realignment | 3–6 hours |
| Corporate Earnings | Gradual follow-through | 12–24 hours |
| Political/Geopolitical News | Extended uncertainty | 1–3 days |
If you look closely, the more complex the news, the longer the expiry I use. That’s not about patience, it’s about matching reaction time to event complexity.
The Trades That Still Beat Me
I’d love to say I’ve mastered it, but I still lose, often for predictable reasons.
Sometimes the market reacts slower than I expect. Other times, the first move reverses completely before expiry. I’ve also had trades where the outcome was “mixed”, good headline, bad subtext, leaving direction unclear.
But losses aren’t the enemy; misunderstanding is. Every expiry that expires wrong teaches timing better than any tutorial ever could. I’d rather lose honestly with good logic than win by luck on a spike.
Lessons I Keep Coming Back To
After years of trial and error, I keep returning to a few simple truths about binary options news trading:
- The event matters less than how the market expected it.
- Expiry selection is a reflection of patience and realism.
- Avoid over-trading news, pick your spots carefully.
- Always journal. Without records, you’ll repeat the same expiry mistakes.
Those notes, more than any system, built my improvement curve.
If you’re new to binary options, start by keeping a simple spreadsheet of event type, expiry length, and outcome. After twenty trades, patterns emerge. That’s when you’ll really understand how expiry interacts with news. You can start that process easily on a free demo through our Pocket Option link.
My Current Approach
These days, my setup looks very different from when I started. I split my trades into two groups:
- Short expiries (1–3 hours) around major data releases.
- Longer expiries (up to 2 days) for company earnings or central-bank decisions.
Before each trade, I write down: “What would surprise the market most?” That single question keeps me focused on expectation rather than headline.
Then I wait for confirmation, price action that shows the market reacting genuinely, not just spiking. Only then do I place the binary.
It’s a slower style, but far more controlled. Some days I don’t trade at all. I’ve learned that waiting for the right news-expiry alignment pays more than chasing constant action.
Final Thoughts: Why I Still Trade the News
There’s a certain adrenaline in watching the market react to real-world events, the moment a data point becomes a chart movement. But what keeps me in it isn’t the thrill; it’s the discipline it demands.
Binary options news trading has taught me more about patience and psychology than any technical indicator ever could. It forced me to accept that the market isn’t wrong, my timing often is.
These days, I don’t try to outsmart the market. I try to listen to its rhythm. News gives it a heartbeat; expiry defines its breathing pattern. My job is to synchronize with both.
🚀 The News-to-Expiry Flow
News Release
Market Reaction
My Expiry Decision
Result
And if you want to feel that rhythm yourself, you can open an account here, start in demo mode, and see firsthand how expiry windows react to global events. Record everything. Because in the end, the data you gather from your own trades will be worth more than any article, mine included.
High-Frequency vs. Longer-Expiry Trading Strategies in Binary Options
When I first started trading, I was addicted to speed. Watching the screen light up with constant price ticks gave me a rush. I believed that executing more trades meant earning more. That’s how I fell into what I now call my high-frequency phase quick, adrenaline-filled trades that taught me lessons the hard way. Over time, I realized not every move needs to be captured in seconds. Some setups needed days, even weeks, to mature. That’s when I began exploring longer-expiry strategies.
If you’ve been torn between these two approaches, this story is for you. It’s not theory, it’s how I learned, tested, and balanced both strategies in my own trading journey. And if you’re ready to test your style, you can open an account through our affiliate link to start experimenting yourself.
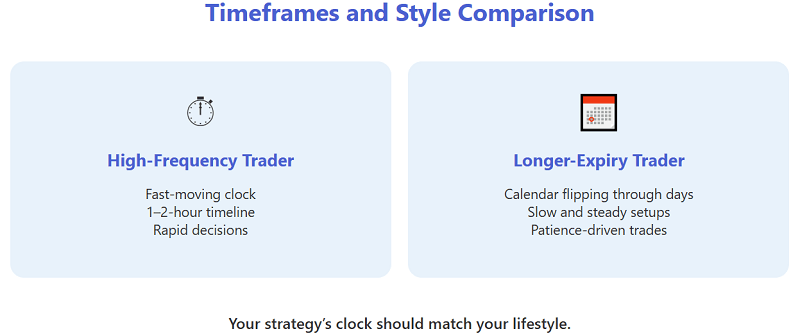
Two Roads in Trading: Fast vs Patient
⏱📊⚡
High-Frequency
Fast-paced trades, quick decisions, instant reactions.
📅⏰🏔️
Longer-Expiry
Steady moves, patient entries, gradual growth.
How Expiry Became the Turning Point
Early on, I didn’t think about “time” as a variable in trading. I’d enter a setup expecting instant results. Sometimes it worked, but often, my timing was just a few hours off, and the opportunity slipped away. It wasn’t the strategy that was wrong; it was my holding period.
That realization pushed me to experiment. Should I keep chasing fast setups, or give trades more time to breathe? The answer wasn’t simple, and it definitely wasn’t in any trading book.
What I Mean by Each Strategy
High-frequency trading, in my context, means multiple trades per day, fast entries and exits based on short-term momentum or breakouts. Positions last minutes to hours.
Longer-expiry trading, on the other hand, is about holding positions for several days or weeks. The focus shifts from instant reaction to patience and timing over a broader market cycle.
| Approach | Typical Hold | Style | Best Suited For |
| High-Frequency | Minutes to hours | Fast scalps, intraday momentum | Traders who can monitor the market closely |
| Longer-Expiry | Days to weeks | Swing or catalyst-driven setups | Traders who prefer a slower, strategic pace |
My High-Frequency Phase
When I first tried high-frequency strategies, the appeal was obvious: instant feedback. I could enter, manage, and exit trades before lunch. I remember a trade on a large-cap stock right after a news spike. Within 30 minutes, I made a small profit, and that rush was addictive.
But that speed came with costs I didn’t understand at first. Transaction fees added up. Emotional fatigue built fast. And false signals, especially during volatile sessions, burned my profits as quickly as I made them.
One trade stands out: I chased a breakout that reversed within an hour. Instead of cutting the loss, I waited for it to turn back. It didn’t. I took a hit. The move eventually came but after I’d already exited. The lesson was clear: if your time frame is short, your timing must be perfect.
The Burnout Loop of Overtrading
1️⃣ Fast Trade
2️⃣ Small Win/Loss
3️⃣ Emotional Reaction
4️⃣ Impulse to Trade Again
5️⃣ Fatigue & Mistakes
6️⃣ Repeat
Trade smarter, not faster – open an account and test your timing balance →
The Overtrading Loop
Break it by slowing down.
Break it by slowing down.
Pros and Cons from My Experience
| Pros | Cons |
| Fast feedback on performance | High mental and emotional demand |
| Minimal overnight exposure | Slippage and transaction costs add up |
| Many opportunities daily | Requires near-perfect timing |
| Keeps you engaged with the market | Easy to overtrade and make impulsive errors |
High-frequency trading can work, but only if you have the discipline to treat it like a process, not a thrill.
My Shift Toward Longer Expiry
After months of nonstop screen time, I felt drained. The constant need for action made me impatient. So, I decided to hold trades longer, sometimes a few days, sometimes a couple of weeks.
The first few attempts were uncomfortable. Prices would stagnate for days, and I’d question every decision. But one particular trade changed my mindset. I held a mid-cap stock through a consolidation period, expecting a breakout after upcoming earnings. Nothing happened for a week. On the ninth day, the stock rallied over 8%. That win wasn’t just financial, it was psychological.
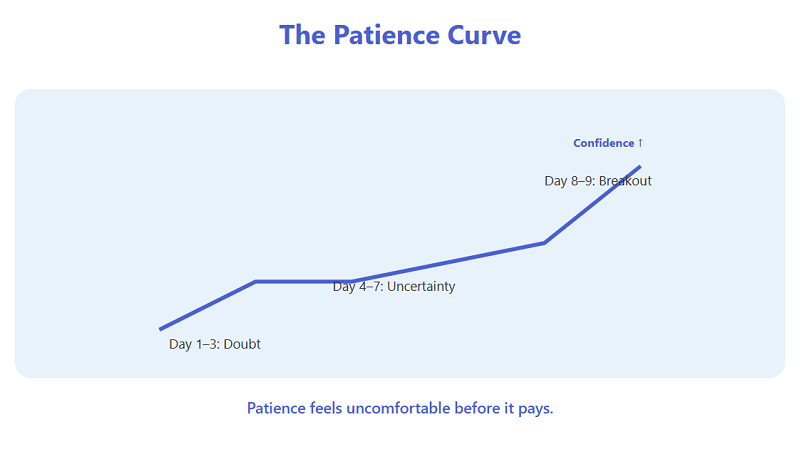
I realized that patience could be just as powerful as speed, if applied to the right setup.
What I Learned
Holding trades longer forced me to plan more carefully. Stops had to be wider, risk had to be sized thoughtfully, and overnight exposure had to be accepted. It also made me more selective; every trade had to justify the time and capital it required.
| Pros | Cons |
| Potential for larger gains | Exposure to overnight and weekend risk |
| Less daily screen stress | Fewer trading opportunities |
| Allows trades to mature fully | Requires patience and conviction |
Comparing Both Styles
After testing both for months, I created a simple way to decide which one to use.
| Factor | High-Frequency | Longer-Expiry |
| Time Sensitivity | Very high | Moderate |
| Risk per Trade | Smaller, frequent | Larger, less frequent |
| Emotional Load | High (constant action) | Medium (requires patience) |
| Best Market Type | Volatile or reactive | Trending or catalyst-driven |
| Cost Impact | High from volume | Lower per trade |
| Suitable For | Active, screen-heavy traders | Strategic, patient traders |
When I look at a setup now, I ask: Does this move need minutes or days to play out? That single question keeps me aligned with the right approach.
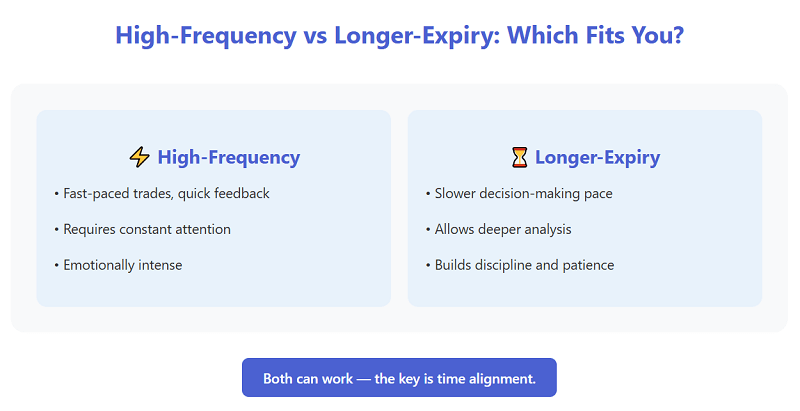
Lessons from Real Trades
I’ve made every mistake you can imagine: exiting too early, holding too long, mixing strategies mid-trade, ignoring risk on weekends. The cost wasn’t just monetary, it was mental clutter.
Now, I separate both strategies clearly. I keep a smaller “fast” bucket for high-frequency setups and a larger “slow” bucket for swing trades. That separation helps me measure performance accurately and manage risk more calmly.
A quick example: A short-term index ETF trade gave me a neat 0.8% gain in under an hour. Later that week, a longer-expiry position on a tech stock ran 11% over nine days. The difference wasn’t just profit, it was the kind of effort and patience each required.
Common Mistakes Traders Make
- Treating a long-term setup like a day trade
- Trading too often when no clear signals exist
- Holding overnight without planning for event risk
- Mixing both strategies in one account without structure
- Underestimating the cost of mental fatigue
These are simple errors, but they compound fast. I learned to treat each style as its own discipline.
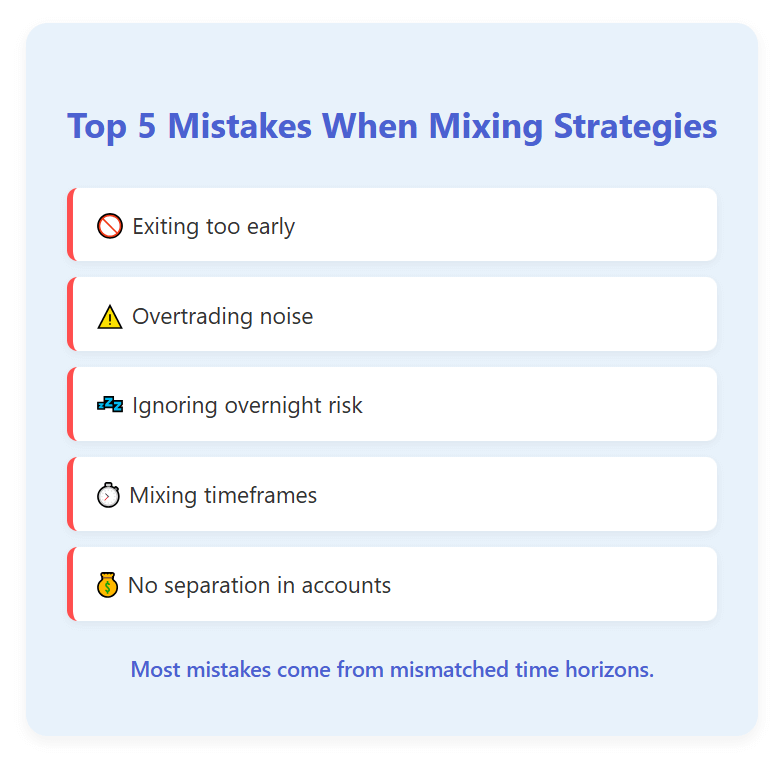
What Most Articles Miss
When you research “high-frequency vs long-term strategies,” you’ll find repetitive advice, “choose what fits your personality,” “manage risk,” “stay disciplined.” What’s usually missing is the real cost of execution, the fatigue, the waiting, the lost capital efficiency, and the operational drain.
High-frequency trading demands constant energy. Longer- expiry trading demands emotional endurance. Most traders underestimate both.
Finding Your Fit
If you’re unsure where to start, here’s how I’d approach it today:
- Decide how many hours per day you can actively trade.
- Be honest about your temperament, do you crave constant feedback or prefer to think in slow, deliberate moves?
- Start tracking your results by style. You might be surprised which one truly fits.
- Separate your accounts or at least your capital buckets for each strategy.
This structure helped me avoid cross-contamination between styles.
If you’re serious about testing both approaches, you can open an account via our affiliate link and dedicate a portion to each strategy to see which feels right in live conditions.
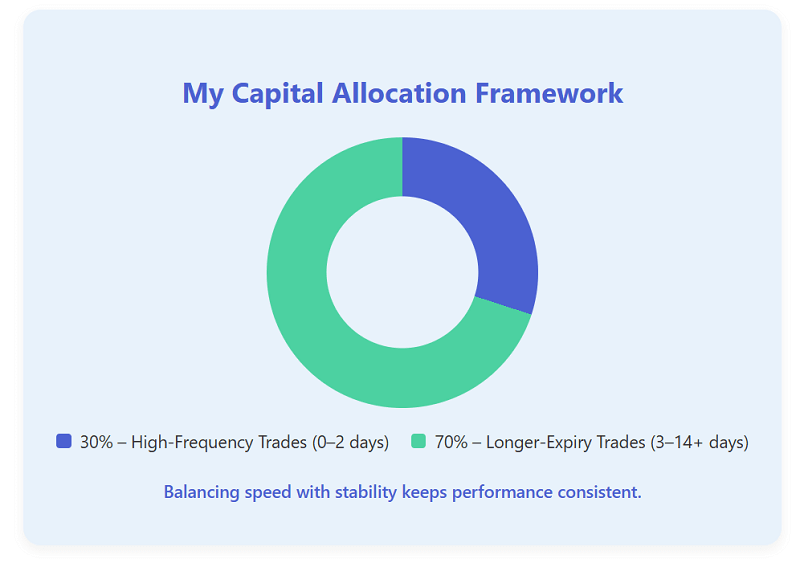
My Current Approach
I now use a hybrid system:
- About 30% of my capital goes into fast, tactical trades that last less than a day.
- The remaining 70% is for slower, swing setups driven by fundamentals or catalysts.
This balance keeps me engaged but grounded. I get the satisfaction of activity without burning out.
Final Takeaways
Trading frequency is not just about style, it’s about self-awareness. Both high-frequency and longer-expiry strategies have their place, but each demands a different mindset. High-frequency rewards precision. Longer-expiry rewards patience. The best traders I’ve met excel because they know which one suits them best, and they don’t mix the two without purpose.
As for me, I lean toward longer-expiry setups now. They match my rhythm, reduce noise, and align with my broader market view. But I still enjoy the occasional fast trade, it keeps me sharp and connected to market flow.
If you’re ready to discover which approach fits you best, open your trading account here and start documenting your own journey. The lessons won’t come from reading, they’ll come from trading, reflecting, and adapting.
Choosing Your Trading Clock
⏱ High-Frequency
(Precision)
(Precision)
🕰 Longer-Expiry
(Patience)
(Patience)
Your edge isn’t just your entry — it’s your timing.
Start your trading journey today →
Trend vs Countertrend Trading in Binary Options: My Trial, Triumphs and Truths
I still remember the session on March 17, 2025, when I entered a Call on a 5-minute binary using what seemed to be a strong trend signal. The price had broken higher in EUR/USD and looked ready to continue. I clicked “Call,” expecting the momentum to carry me forward, but instead, the move reversed sharply and I lost. It was my second trade of the day, and my confidence took a hit. That was the moment I realized that trading trend style and trading countertrend style might look similar on charts but behave very differently in real binary options trading.
From that loss onward, I started logging every trade, whether it followed the trend or went against it. Over time, I built a journal of how both styles performed in live markets. Here, I’ll share what I learned from that journey, the trades that worked, the ones that hurt, and which approach actually paid more in the end. If you want to try the same strategies live, you can open a Pocket Option account with my affiliate link and see how these setups behave under real conditions.
Why the Traditional Debate Misses the Point
Most articles online about Trend vs Countertrend Trading focus on swing or forex trading. They ignore the demands of short-term binary options, where trades expire in minutes, not hours. Many guides define countertrend trading as entering against the main direction when expecting a correction, and trend trading as simply following the broader movement. What they rarely show is how these decisions unfold on 1- to 15-minute expiry trades.
When I tested both styles in real time, I quickly realized that timing mattered far more than theory. Trend setups often failed because I entered too late, while countertrend setups worked only when the market had clearly exhausted itself. I found a massive gap between what I read online and what happened in my trades..
How I Tested Both Styles
I treated this project like a personal experiment. I defined two clear strategies.
Trend Style
- Direction: trade with the prevailing short-term trend
- Expiry: mostly 3- to 5-minute binaries, occasionally up to 15 minutes
- Trigger: pullback to support or resistance, then continuation with momentum
Countertrend Style
- Direction: against short-term trend, expecting exhaustion
- Expiry: similar short durations
- Trigger: overbought or oversold readings, divergence, or reversal candles near levels
Every trade was recorded with details like asset, time, expiry, entry reason, and result. Over time, patterns emerged. I saw where each style thrived and where it broke down.
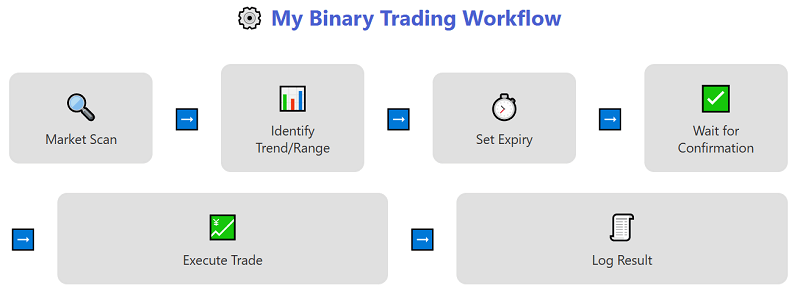
Lessons from Trend Trading
During one London session in April, EUR/JPY was trending up cleanly. After a brief pullback, I entered a Call as the price resumed its move. The trade expired in the money. That was the kind of flow I wanted to capture.
Trend trading worked best when I entered early in a new move, not when I chased an overextended breakout. The advantages were clear:
- The direction bias was simple.
- Price action aligned with the overall movement.
- Fewer emotional reversals during trades.
But it wasn’t perfect. When trends weakened, I often entered too late and lost. One mistake came on a stock index breakout where the move had already run its course. The moment I entered, volatility dropped and the trend faded. The trade expired out of the money.
After several cases like that, I learned to wait for pullbacks instead of chasing candles that looked strong but lacked real energy.
Lessons from Countertrend Trading
Countertrend trading attracted me because of the excitement. I wanted to catch tops and bottoms. I remember one night in 2024 trading a commodity index that had spiked upward for hours. RSI was extreme, a long upper wick formed, and I entered a Put. The reversal came fast and paid instantly. That was the thrill of countertrend trading.
But just as quickly, I learned its danger. On gold in May 2025, I entered another Put expecting a reversal. Instead, the uptrend continued for three more candles. Loss. I realized that trading against momentum is like standing in front of a moving train. Sometimes you catch it perfectly, but often, you get hit.
To make countertrend setups safer, I began using confirmation signals. These included double tops or bottoms, wicks rejecting strong levels, and RSI divergence that persisted for multiple candles. I also cut my position size in half for every countertrend entry.
Trend vs Countertrend: What the Data Showed
After 300 trades logged in my journal, the pattern became clear. Trend style had more consistent wins, while countertrend style had higher risk but occasionally higher reward.
| Style | Number of Trades | Win Rate | Payout Consistency | Common Reason for Loss |
| Trend Trading | 180 | 58–60% | Steady | Entering too late in the trend |
| Countertrend | 120 | 50–53% | Volatile | Reversal fails or trend resumes |
The numbers don’t tell the whole story, though. Trend trades often gave me confidence and structure. Countertrend trades gave excitement and potential for quick wins—but also frustration when reversals didn’t come.
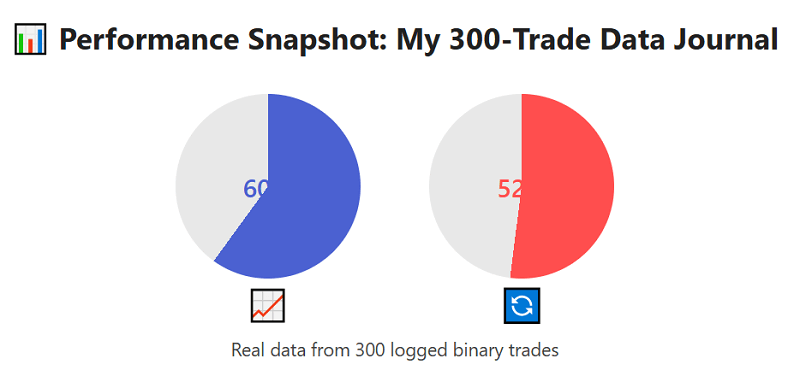
If you want to test these insights yourself, you can sign up for Pocket Option, use the 50% deposit bonus, and practice both styles on demo and live charts.
When Trend Trading Works Best
Trend trading shines in markets with steady momentum—currencies during London or New York overlap, trending indices, or volatile synthetic assets. I look for:
- Pullback into trend direction
- Momentum candles confirming continuation
- No nearby resistance or support that could block movement
In these conditions, trend trading feels like following the river rather than swimming against it.
When Countertrend Trading Works Best
Countertrend trading is most effective when volatility is stretched. Markets cannot trend forever. After long one-sided runs, you’ll often see price rejection wicks, RSI divergence, or volume tapering. These moments invite short-term reversals, which can be ideal for 1- to 3-minute binaries.
Still, success here depends on confirmation. I wait for at least one strong rejection candle before entering. Patience saves money in this style.
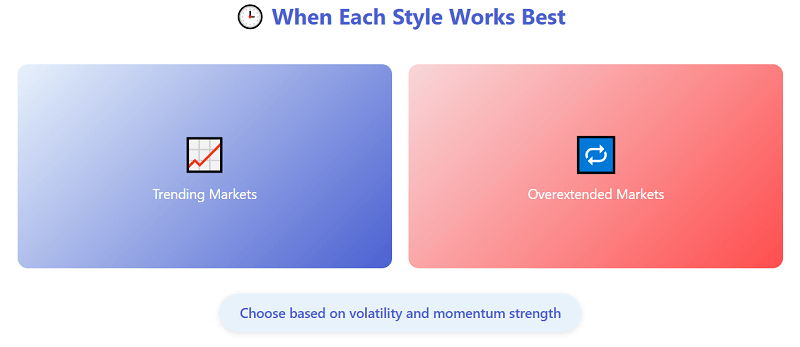
Comparing Emotions in Both Styles
Trading trend style feels calm and methodical. I focus on structure and wait for pullbacks. Countertrend, on the other hand, is emotional. It tempts you to predict tops and bottoms. When it works, it feels brilliant. When it doesn’t, it feels foolish.
Through my trading journal, I discovered that my mindset often performed better with trend trades. They required less prediction and more reaction.
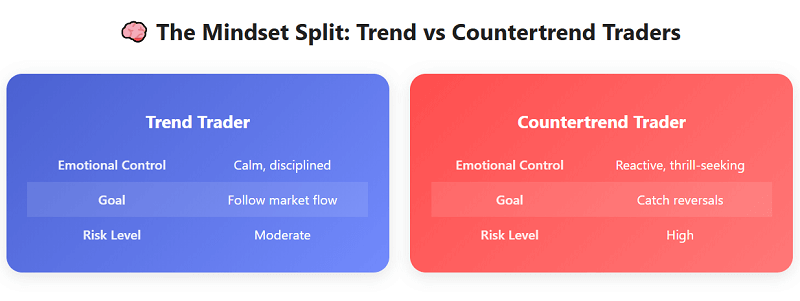
The Turning Point: Choosing My Style
By mid-2025, after hundreds of trades, I finally accepted that trend style suited me better. It offered stability, higher accuracy, and a rhythm I could manage even during stressful sessions. Countertrend style still had its place but more as a specialty play when the market screamed exhaustion.
I began to base my daily plan around trend opportunities. Whenever I identified a clean trend and momentum confirmation, I traded. When the market chopped sideways or looked overextended, I stepped aside or switched to smaller, cautious countertrend positions.
Lessons That Changed My Results
- Trade early in the trend, not at exhaustion.
- In countertrend setups, demand confirmation, not guesses.
- Skip trades in ranging or noisy markets.
- Never risk more because one style feels “due” to win.
These rules helped me smooth my equity curve and remove emotional spikes.
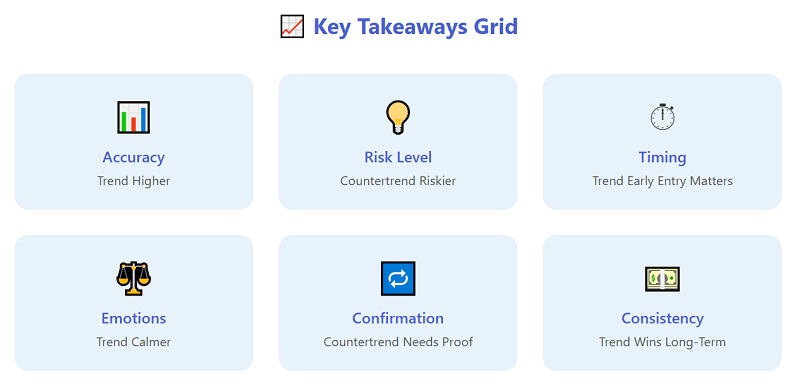
Key Takeaways
| Aspect | Trend Trading | Countertrend Trading |
| Accuracy | Higher on average | Lower but faster payoff potential |
| Emotional Control | Easier | Harder |
| Learning Curve | Moderate | Steep |
| Best Market Type | Trending | Overextended or exhausted |
| Risk Level | Moderate | High |
The Real Answer: Which Pays More?
For me, trend trading paid more not just in profit, but in peace of mind. Countertrend trades gave the occasional adrenaline-filled win, but my trend setups delivered consistent outcomes.
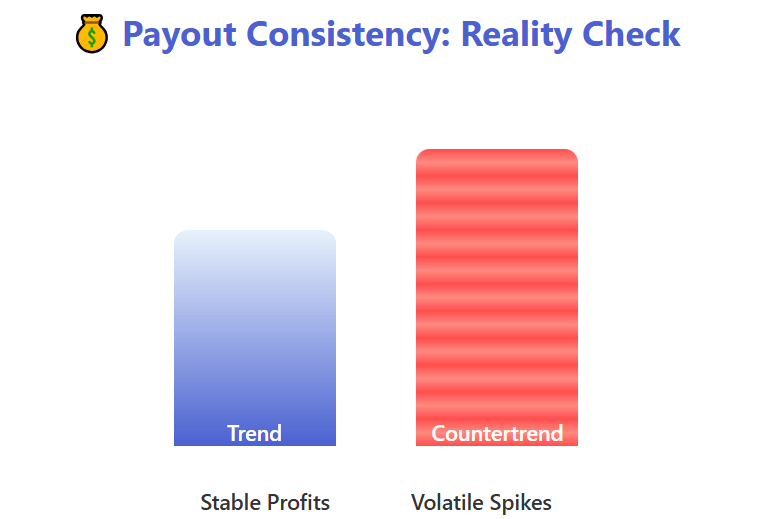
However, that doesn’t mean countertrend trading has no place. Some traders thrive on reversals. What matters is data, discipline, and understanding which environment suits you.
If you’re ready to explore this yourself, open your Pocket Option account, claim the 50% deposit bonus, and start testing both approaches side by side. Track your results honestly. Let the market show you what fits your personality and discipline.
Final Thoughts
Trend vs Countertrend Trading in Binary Options taught me one big lesson: there is no universal winner, only what fits you best. I still trade both styles occasionally, but I know which one pays more in the long run for my temperament.
Every trade adds data to your understanding. Keep your journal, study your patterns, and remember—patience and consistency will always pay more than prediction.
When you’re ready to put these lessons into practice, sign up for Pocket Option, use your 50% bonus, and start building your own trading story, one real decision at a time.
🎯 Test Both Strategies on Pocket Option
Trend Strategy
📈 Follow the Market Flow
🎯 Your Data‑Driven Edge
Countertrend Strategy
🔁 Catch Market Reversals
Start your journey on Pocket Option. Get a 50% deposit bonus and test both strategies live.
Start Trading Now
Combining RSI and Bollinger Bands in Binary Options: My Trading Journal
I still see that chart in my mind from early 2025. I had one of my first serious attempts at combining RSI and Bollinger Bands on EUR/USD during a volatile London session. Price touched the lower Bollinger Band, RSI dropped deeply into oversold range, and everything looked aligned. I entered a Call. In minutes the candle collapsed further and the trade expired out of the money.
That trade hurt, but it also forced me to rethink how I used indicators together. Since then I have refined a method that works better for short-expiry binary options. In what follows I walk you through my experiments, the setups that survived, and how I manage risk in real time.
If you want to test alongside me, open a Pocket Option account with my affiliate link and try these setups live.
Why Most RSI + Bollinger Band Strategies Break in Live Trading
When I first looked up “RSI Bollinger Bands strategy for binary options,” I found many guides showing ideal charts and perfect entries. But almost none address the challenges of fast expiry trading: false signals, volatility squeezes, and missing context.
In many guides, price touching the band automatically triggers entry. In practice I found many failed setups. I also saw RSI clinging at extreme levels without reversal. Those losses encouraged me to build a more disciplined approach that asks: under what conditions do these signals align with reality?
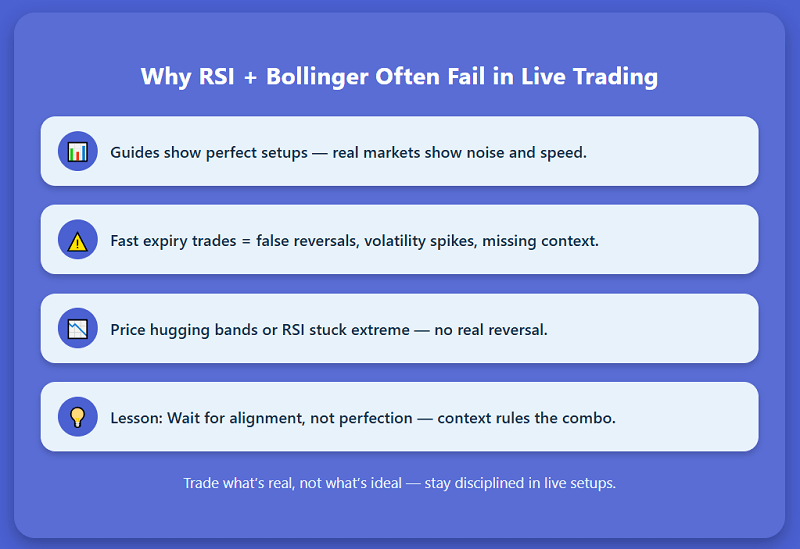
Learning to Read These Indicators Together
RSI and Bollinger Bands are telling two sides of the same story. Bollinger shows where price sits relative to volatility, while RSI shows internal momentum strength or exhaustion. When they agree on direction, there is stronger conviction. When they diverge, it is often a trap.
My process now always starts with a volatility context. If bands are extremely tight, I know breakout chances exist but I won’t act until RSI confirms. If bands are already very wide, I expect trend pressure, not reversals. This judgment is what separates setups I trade from those I skip.
My Indicator Settings for Binary Use
I use standard settings with small tweaks:
- Bollinger Bands: 20-period moving average with ±2 standard deviations. On certain high volatility assets I reduce deviation slightly to 1.8 to increase responsiveness.
- RSI: 14 period by default. Instead of rigid 30/70 boundaries, I shift to dynamic zones (for example, 20–80 or 25–75) depending on how the market is behaving.
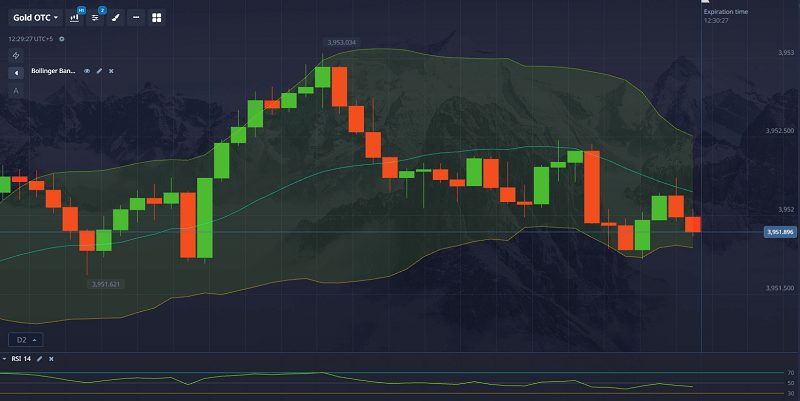
These settings are not fixed rules but starting points. I always monitor how the tools behave in live markets before trusting them.
Two Core Methods That Worked for Me
Over months of trial and error, I found two methods that survived enough losing streaks to be useful.
Method A: Band Bounce with RSI Reversal
In this setup, price touches or briefly exits a Bollinger Band and then pulls back. At the same time, RSI dips into an extreme zone and begins to reverse. I enter only once price closes back inside the band in the direction of the reversal.
For example in March 2025 on GBP/USD, price broke slightly below the lower band, RSI dropped to about 25, then reversed upward. When the next candle closed bullish inside the band, I took a Call. It worked. That trade reinforced to me that hesitation and confirmation matter far more than speed.
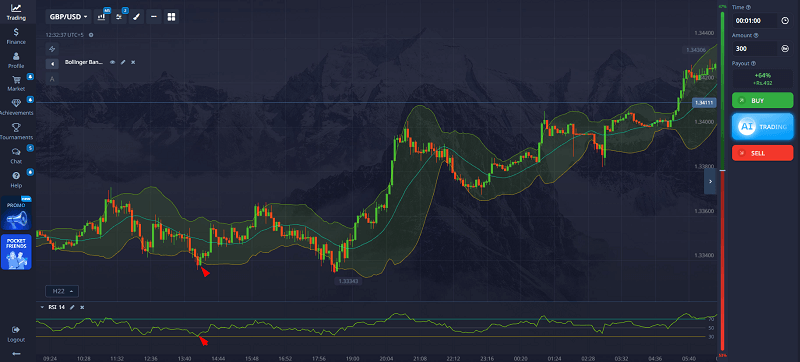
Method B: Band Squeeze then Breakout, Confirmed by RSI
When Bollinger Bands contract for several bars, I anticipate a volatility expansion. When price breaks out above or below the bands, I check if RSI is turning in the same direction. If RSI supports the breakout, I take the trade. If it hesitates, I skip.
I tested this on EUR/JPY in April 2025. Bands were tight, price broke upward, RSI rose from midrange. That setup produced profit. But in a later Aussie session, bands squeezed and price broke out, but RSI stalled. I refused the trade and later saw the move reverse. That experience refined my discipline.
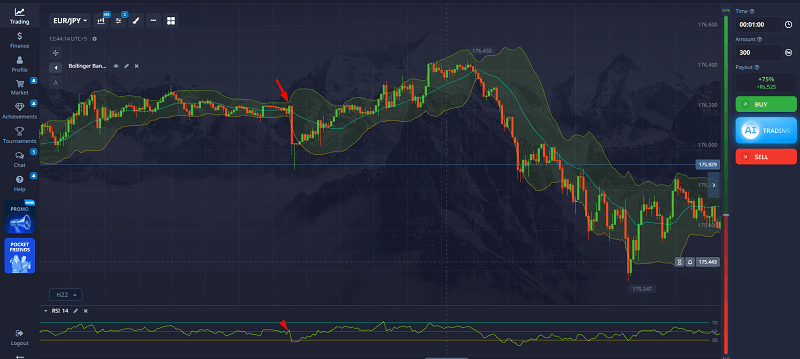
Trade Stories from My Journal
Trade 1: Bounce off Lower Band
Asset: USD/CHF, 5-minute expiry
Price touched the lower Bollinger Band. RSI dropped to ~23 and then reversed upward. I waited for a confirming candle closing inside the band before entering a Call. The trade expired in the money.
That trade nearly fooled me because the RSI felt too extreme. I almost skipped it. But I trusted the strong band reaction more than a fixed RSI boundary.
Trade 2: Failed Breakout
Asset: AUD/USD
Bands were tightly squeezed. The price broke above upper band and I saw RSI climb from 55 to 68. Thinking alignment was okay, I entered. Price reversed shortly and the trade lost.
That loss taught me that a breakout alone is not enough. RSI must continue its momentum beyond the breakout, not just approach it.
Trade 3: Clean Reversal
Asset: EUR/GBP
Price touched the upper band, RSI climbed above 80, then began to turn down. I waited one extra bar for confirmation, then entered a Put. It succeeded smoothly.
That trade reminded me that the best opportunities show patience; they don’t force themselves.
When the Combo Stops Working
There are times when RSI and Bollinger fail together. In strong trending markets, price may ride the outer band for long periods and RSI clings at extreme values without reversing. In those conditions reversal setups often fail.
During news releases or extreme volatility, candles blow past bands, RSI spikes erratically, and signals lose coherence. In those moments I stay out until the market stabilizes.
When volatility collapses and bands compress too tightly, false reversals abound. I learned that skipping setups is sometimes my best trade.
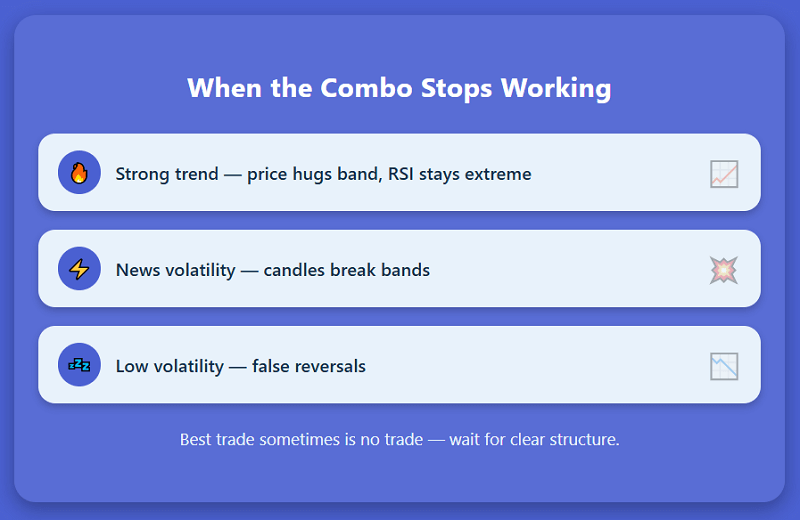
My Entry / Exit Checklist
Before entering a trade I mentally run through this checklist:
- Bollinger Bands show a condition that allows movement (not extremely tight or extremely wide)
- Price touches or slightly breaches a band
- RSI is in an extreme zone and begins to reverse
- A confirmation candle closes in the direction of the intended trade
- The broader trend or context does not strongly contradict the signal
If all align, I enter. If one feels uncertain, I skip the setup. Skipping weak setups has saved me far more than chasing “perfect” ones.
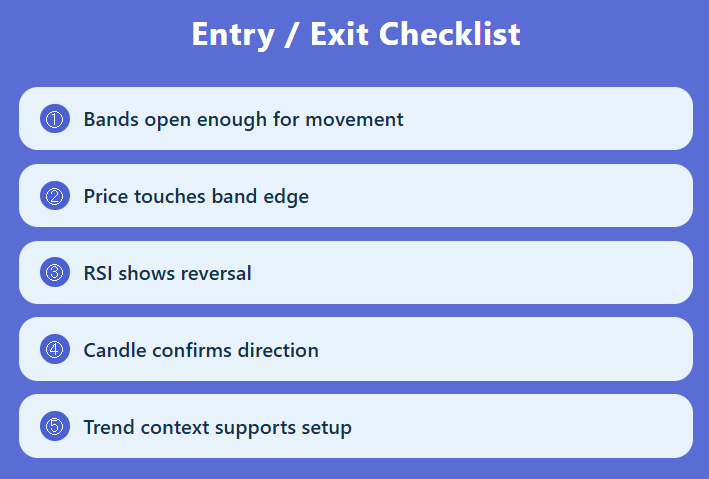
If you want to follow this same flow with real charts, open your Pocket Option account and test these setups live.
Results and Realistic Expectations
From January through August 2025, I tested this RSI + Bollinger combo in about 200 trades. My net win rate after costs has been around 54 to 57 percent. I experienced losing streaks (five or six trades) but never blew capital because I size conservatively and stay disciplined.
This method will never be perfect, it is about tilting probabilities in your favor, not guaranteeing success.
What Makes My Approach Different
Many strategies online simplify this method into “price hits band, buy or sell” or “RSI below 30, buy.” Real trading is messier. My approach insists on context, confirmation, and alignment. I do not act unless the setup feels coherent across indicators and price structure.
I also treat patience as a critical filter. If I have to force a signal, I skip it. The best setups seem obvious, they don’t require convincing.
How to Practice Before Trading with Real Money
Spend several weeks in demo mode testing RSI + Bollinger combinations under different volatility conditions. Screenshot every winning and losing setup and analyze what went right or wrong.
Once your performance is stable, you can begin live testing with small amounts. Pocket Option supports small position sizes, making it ideal for cautious live testing. Sign up now and take advantage of a 50% deposit bonus to give your testing a bit of cushion.
Final Thoughts
Learning to combine RSI and Bollinger Bands in binary options taught me humility. Patterns and indicator signals are helpful hints, not guarantees. What matters is how you interpret them in real time, under pressure, and how you learn from both wins and losses.
If you apply this method with discipline, record your outcomes, and treat every trade as data, you will gradually refine your edge. When you feel ready, open your Pocket Option account, claim the 50% deposit bonus, and test these setups under live conditions. Let your charts teach you what works in your market.
Top 3 Binary Options Strategies for Consistent Success (2025 Edition)
Crazy Simple Pocket Option Strategy with 70% Win Rate (Works Instantly)
ExpertOption Demo Account Full Guide (2025)

When I first opened an ExpertOption demo account back in early 2025, I wasn’t sure what to expect. I had tried other brokers before, but most demo accounts either felt too restrictive or too far removed from real trading conditions. What I found with ExpertOption was surprisingly different: a place where I could make mistakes, test strategies, and actually progress without risking a single dollar of my own.

This guide isn’t a generic walkthrough. It’s my own journey—how I set up my demo account, how I learned to reset it when things went sideways, and how I built a progression plan that made me feel more prepared for real trading. If you’re curious about whether the demo account is worth your time, I’ll share every lesson I picked up along the way.
👉 If you want to experience ExpertOption’s demo for yourself, you can open a free account here and follow along as you read.
Why I Started With the Demo Account
I’ve blown real accounts before. Anyone who has traded long enough knows that the early stage is usually more about losing money than making it. So this time, I made a conscious decision: before risking anything real, I’d master the demo.
What stood out immediately was that ExpertOption gives you $10,000 in virtual funds right away. No registration hassle, no bank details, just a one-click entry into the platform. That might sound small compared to some brokers that hand out $100,000 demos, but honestly, I prefer this, it’s closer to what I’d realistically fund in a live account.
I decided to treat this money as if it were my own. That mindset changed everything.
How I Set Up My ExpertOption Demo Account
The setup process was almost too simple. Within a minute, I was already looking at charts. Still, I had to customize a few things to make it “my space.”
Here’s what I did in the first 10 minutes:
- Chose the dark theme to reduce eye strain.
- Adjusted the chart type to candlesticks because that’s what I was comfortable with.
- Added a few key indicators I always rely on: RSI, MACD, and Bollinger Bands.
- Created a watchlist with my main assets: EUR/USD, BTC/USD, Apple, and Gold.
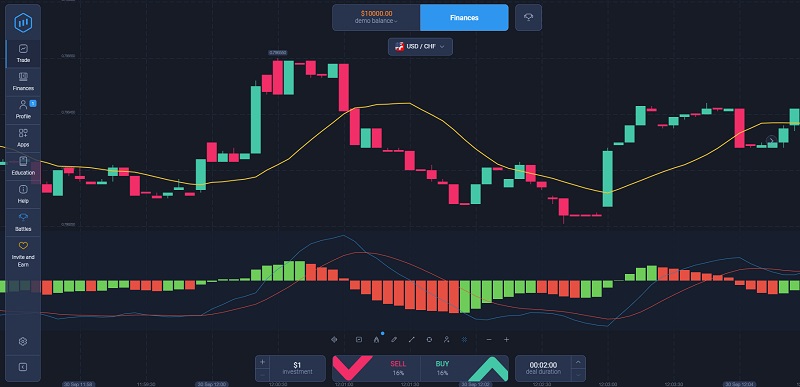
I even kept a small notebook on my desk. Every trade I took, I wrote down what I saw, what I felt, and what the outcome was. It felt like I was creating a personal trading diary that would guide me later.
The First Trades: Excitement and Reality
The first few trades on the demo account were pure adrenaline. I clicked “buy,” watched the candles move, and felt like a genius when I won the first one. But then I lost three trades back-to-back, and it reminded me: the demo account might not carry real risk, but it sure mirrors real emotions.
To keep myself grounded, I started applying risk management rules. I never risked more than 2% of my demo balance per trade. That way, I wasn’t just pressing buttons randomly, I was building habits that I could later use in my real account.
Here’s a quick snapshot of how my first week looked:
| Day | Trades Taken | Wins | Losses | Notes |
| 1 | 8 | 5 | 3 | Overconfident start |
| 2 | 6 | 2 | 4 | Forced trades, learned patience |
| 3 | 5 | 3 | 2 | Better entry timing |
| 4 | 7 | 4 | 3 | More consistent |
| 5 | 5 | 3 | 2 | Built a routine |
By the end of the week, I wasn’t chasing wins anymore. I was learning discipline.
Resetting the Demo Account: My Safety Net
The feature I found most useful was the reset option. Whenever my demo balance went too low or my testing became messy, I just reset it back to $10,000.
At first, I abused this feature. I’d blow half the account, reset it, and pretend nothing happened. But then I realized if I did that in real trading, I’d be bankrupt. So I started setting rules for when I was allowed to reset:
- If I dropped below $8,000, I forced myself to stop and analyze what went wrong.
- I only reset after completing a full 10-day trading cycle.
- Before resetting, I reviewed all my trades, highlighted patterns of mistakes, and adjusted my approach.
The reset button wasn’t just a convenience. It became my checkpoint, like restarting a level in a game but carrying forward the knowledge I gained.
Building a Progression Plan
After two weeks, I realized I needed structure. The demo account was powerful, but without a plan, I could easily get lost. So I designed a progression roadmap:
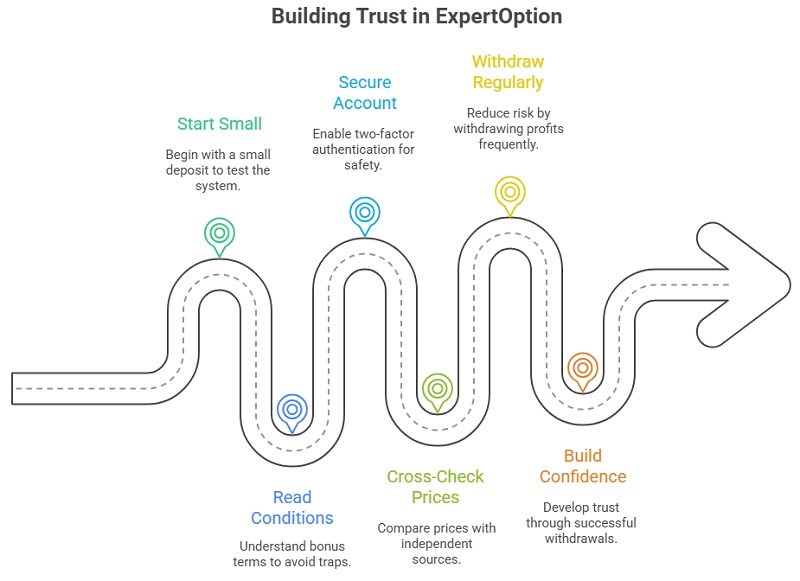
Phase 1: Familiarization (Week 1–2)
- Focused on platform tools and order execution.
- Tested basic strategies like moving average crossovers.
Phase 2: Strategy Testing (Week 3–4)
- Tried candlestick setups like engulfing and pin bars.
- Kept track of win/loss ratios.
Phase 3: Risk Discipline (Week 5–6)
- Applied strict money management rules.
- Practiced trading smaller sizes consistently.
Phase 4: Realistic Simulation (Week 7–8)
- Treated the demo as if it were a $500 real account.
- Limited myself to the number of trades I’d realistically take in a day.
By the end of two months, I didn’t just know the platform. I had habits. I had strategies. I had confidence.
👉 If you’re ready to build your own progression, you can start your demo journey here.
Lessons I Learned From the Demo
Every trader will take away different lessons, but here are the ones that stuck with me:
- Don’t treat it like free money. The demo only works if you treat it as real.
- Keep a journal. Writing down trades helped me spot mistakes faster than anything else.
- Use resets wisely. It’s a learning tool, not a get-out-of-jail card.
- Simulate real conditions. Trade as if your family savings were on the line, even though they aren’t.
Frequently Asked Questions About ExpertOption Demo
1. Is the ExpertOption demo account free?
Yes, completely free. What surprised me was that I didn’t even have to provide payment details or commit to a deposit. I opened the platform, clicked “try free demo,” and instantly had $10,000 virtual funds waiting. That gave me peace of mind—it didn’t feel like a trap to push me into funding right away.
2. Can I reset my demo account balance?
Yes, you can reset it anytime, back to $10,000. I used this a lot in my first week, but eventually I disciplined myself. My rule became: only reset after a 10-day review cycle. That way, the reset became a checkpoint instead of a cheat code.
3. Does the demo account match real trading conditions?
In terms of price charts, assets, and order speed, it’s almost identical. But the real difference is psychological. When I trade with real money, my hands sometimes hesitate before clicking. On the demo, I never had that fear. So I had to artificially create discipline, like limiting myself to just 3 trades a day, so it would feel closer to reality.
4. How long can I use the demo account?
There’s no expiration. I used mine for two months straight before going live. Even today, I still switch back to demo whenever I want to test a new idea or indicator without pressure. I think of it as my permanent sandbox.
5. Should I switch to a real account right away?
Personally, I waited until I had at least 20 consecutive days of consistent results on demo before funding real money. I didn’t care if I won or lost a trade here and there; what mattered was that my risk management felt automatic. If you can’t resist going all-in on demo, you’re not ready for live.
6. Can I use the demo on mobile?
Yes, and I did often. ExpertOption’s app made it easy to sneak in practice during commutes or lunch breaks. But I noticed I was more careless on mobile, so I set myself a rule: analysis on desktop, quick execution or review on mobile.
7. What’s the best way to practice with the demo?
What worked for me was building scenarios. For example, one week I only traded EUR/USD during the London session. Another week, I focused only on crypto volatility. This gave structure instead of random button-clicking.
8. Does trading on demo improve psychology for live trading?
Yes and no. It definitely helped me build habits like risk sizing and patience but the emotional hit of losing real money still felt different. That said, by journaling my demo trades as if they were real, I trained my brain to treat them seriously. It softened the transition when I finally went live.
Final Thoughts: Why the Demo Was Worth It
Looking back, the ExpertOption demo account wasn’t just a playground, it was a classroom. It gave me the freedom to fail, the ability to reset, and the structure to build real trading discipline.
Would I recommend it? Absolutely. But only if you use it seriously, as if every dollar belongs to you. That’s how I turned a free tool into a stepping stone for real progress.
👉 If you want to start your own trading journey, you can open an ExpertOption demo account here today.
ExpertOption Safety: Is It Legit or a Scam?

When I first heard about ExpertOption, my reaction was pure skepticism. I had read enough horror stories about brokers vanishing with traders’ money to know that appearances can be deceiving. Some brokers offer shiny platforms, flashy bonuses, and quick promises of profits, but the moment you try to withdraw, the story changes.
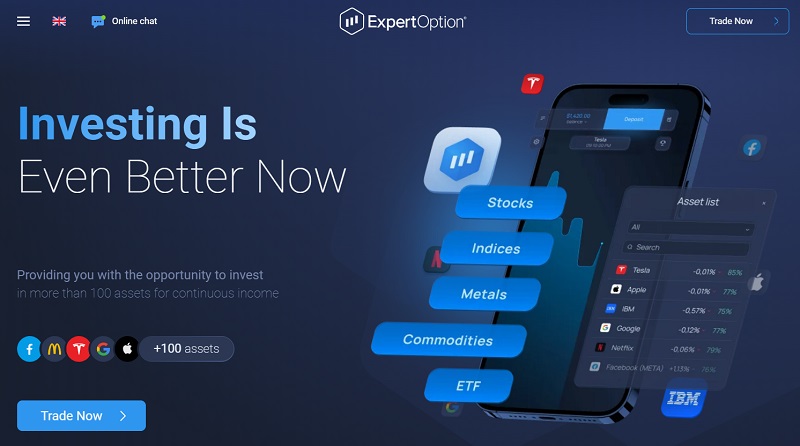
That is why I decided to test ExpertOption for myself. I wanted real answers, not reviews copied from forums or claims written by affiliates who never even traded. In this article, I’ll walk you through my personal experience with ExpertOption, from my first deposit all the way to my withdrawals, the red flags I watched out for, and the final lessons I learned about whether this broker is actually safe or just another scam.
If you’re sitting on the fence, you can follow my approach and start small. And if you already feel ready to give it a shot, you can open an ExpertOption account here and try the same safety checks I did.
My First Impressions of ExpertOption
The very first time I opened the ExpertOption platform, I noticed how different it looked compared to some of the brokers I had tried before. The app was smooth, mobile-friendly, and clean. The charts loaded quickly, and the layout didn’t overwhelm me.
I spent my first evening just using the demo account. The $10,000 in virtual funds allowed me to test out trades without any pressure. But here is the catch. A demo account will always feel safe because it is not your real money. I knew the real test of ExpertOption safety would only begin when I risked my own funds.
My First Deposit and Initial Tests
To start cautiously, I deposited $50 using my Visa card. The money appeared instantly in my trading balance. That was a positive sign. I had seen unregulated brokers before that took days to process deposits, only to delay withdrawals later.
During my first week, I avoided big trades. I kept my order sizes to $2 or $5 and focused on testing execution speed. I wanted to see whether the broker would manipulate entry prices or freeze the platform during active trades. To my surprise, every order was executed in less than a second. The price charts also matched what I was seeing on TradingView.
By the end of week one, my account balance was at $62. Nothing crazy, but enough to move to the next stage of my safety test: the withdrawal.
My First Withdrawal Experience
On a Tuesday morning, I submitted a request to withdraw $30 back to the same Visa card I had used for deposit. Within minutes, I received an email confirmation that the request had been received. By Thursday afternoon, the funds were already back in my bank account.
That was the first moment I started trusting ExpertOption. Scam brokers usually create unnecessary obstacles, such as asking for documents they never requested before or blaming the payment provider for endless delays. ExpertOption processed my withdrawal within their promised timeframe of 1 to 2 business days.
Is ExpertOption Regulated?
Safety is not just about how the app looks or how quickly withdrawals are processed. Regulation is the backbone of trust. ExpertOption is regulated by the Vanuatu Financial Services Commission (VFSC).
To put this in perspective, here is how different regulators compare:
| Regulator | Protection Level | What It Means for Traders |
| FCA (UK) / CySEC (EU) | Very High | Strong protection, compensation schemes, strict oversight |
| VFSC (Vanuatu) | Medium | Licensed and monitored, but less strict than EU regulators |
| Unregulated Brokers | Very Low | No accountability, extremely high risk |
ExpertOption’s VFSC license puts it in the middle. It is not as secure as trading with an FCA-regulated broker, but it is not operating without a license either. For me, that meant I had to be disciplined with my money management and never risk more than I could afford to lose.
Safety Features I Observed on ExpertOption
Over time, I started paying attention to safety features within the platform. Here is what stood out to me:
- SSL Encryption: Every time I logged in or processed a transaction, the HTTPS connection showed me that my data was protected.
- Two-Factor Authentication: I quickly enabled this feature to secure my account. With 2FA, even if someone stole my password, they would not access my funds without my phone.
- Multiple Payment Options: I could choose between cards, e-wallets like Neteller and Skrill, or even local payment solutions. Scam brokers usually push users into shady crypto-only deposits.
- Fixed Payouts Displayed Upfront: Before entering a trade, I could see the exact profit percentage. There were no sudden changes after I won, which is something I had experienced with other brokers.
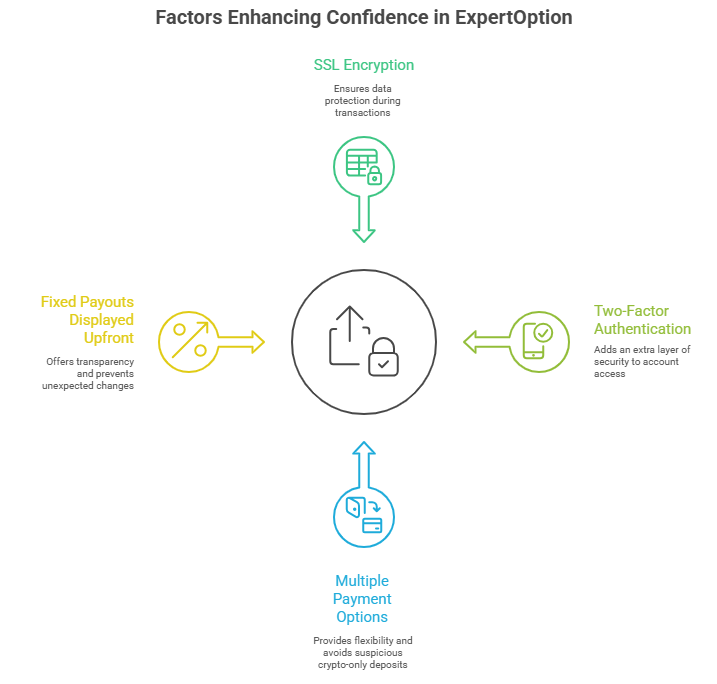
All these features combined gave me more confidence in ExpertOption’s legitimacy.
The Red Flags I Watched Out For
Even with the good signs, I never let my guard down. I was constantly on the lookout for red flags.
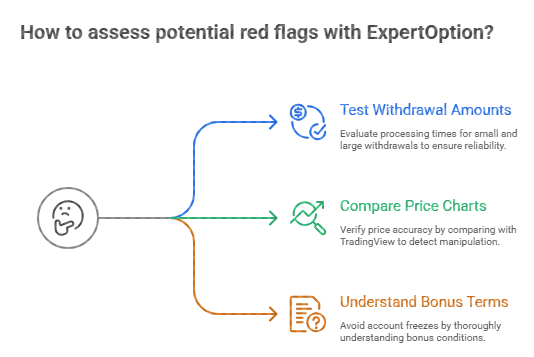
- Withdrawal Delays: I tested different amounts, from $20 up to $200. Smaller withdrawals were always processed quickly. Larger ones took slightly longer, but they still arrived.
- Price Manipulation: I compared ExpertOption’s charts with TradingView multiple times. Prices aligned closely, so I did not spot artificial spikes or manipulations.
- Account Freezes: I had read online complaints from users saying their accounts were frozen. In most of those cases, the issue was linked to bonus conditions. That is why I avoided bonuses at first until I fully understood the terms.
This taught me that most traders who call ExpertOption a scam were likely victims of their own misunderstanding of the bonus system. If you want to dig deeper into that, I explained it thoroughly in my article ExpertOption Bonuses Explained.
Testing Different Payment Methods
To get a fuller picture, I experimented with different deposit and withdrawal methods.
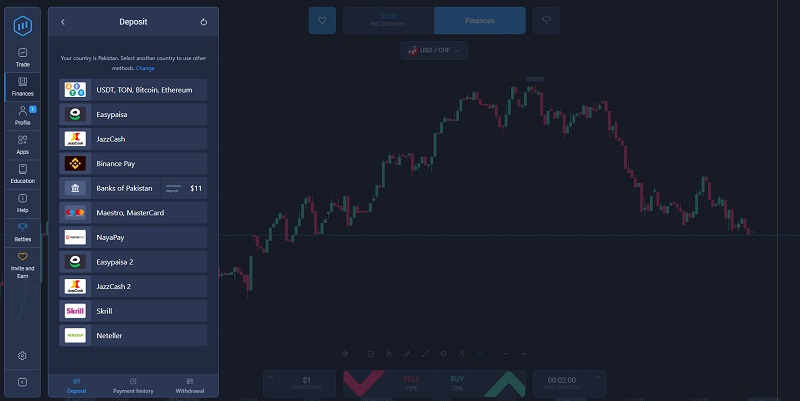
- Visa Card: Instant deposit, 2-day withdrawal.
- Skrill: Deposit took about 10 minutes to reflect, but withdrawal was processed within 24 hours.
- Crypto Wallet: Deposits were fast, but withdrawals took around 48 hours.
From these tests, Skrill was the fastest and most convenient for me. It also had fewer fees on my side compared to cards.
Comparing ExpertOption to Other Brokers I Used
At this point, I had enough data to compare ExpertOption with other brokers I had used before.
| Feature | ExpertOption | Broker A (Unregulated) | Broker B (CySEC Licensed) |
| Regulation | VFSC | None | CySEC |
| Deposit Speed | Instant | 24 hours | Instant |
| Withdrawal Time | 1–2 days | Often delayed or denied | 1–3 days |
| Platform Interface | Modern, smooth | Outdated, laggy | Professional but complex |
| Transparency | Clear payouts | Hidden fees, excuses | Clear rules |
This comparison showed me that ExpertOption sits comfortably in the middle ground. Not as bulletproof as a CySEC broker, but far safer than the unregulated options floating around.
Scam Myths vs Reality
During my research, I kept bumping into claims online that ExpertOption is a scam. I decided to test each of these claims against my own experience.
Myth 1: ExpertOption refuses withdrawals
Reality: Every withdrawal I tested, whether $20 or $200, was processed within the stated timeframe. The only delays I noticed were with larger amounts, and even then they arrived.
Myth 2: ExpertOption manipulates prices
Reality: I compared their charts with TradingView multiple times. Prices matched almost perfectly. I never saw artificial spikes that magically caused me to lose.
Myth 3: Bonuses are a trap
Reality: This one is partly true. Bonuses come with turnover requirements that many beginners overlook. It is not a scam, but if you do not read the conditions, you will feel stuck. I learned to only accept bonuses when I was ready to commit to longer-term trading.
Myth 4: Accounts get frozen without reason
Reality: I never faced this, but based on my research, freezes usually happen when traders violate terms, such as using multiple accounts or trying to withdraw without completing verification.
By testing each myth myself, I realized most scam complaints were either misunderstandings or cases of traders rushing in without reading the fine print.
The Psychological Side of Safety
One thing I realized is that safety is not only technical. It is also psychological. When I saw that I could withdraw profits without issues, my trust grew naturally. Each successful withdrawal acted like a small test, proving that the broker was not planning to run away with my money.
This peace of mind allowed me to scale my deposits from $50 to $500 without fear. Still, I made it a habit to withdraw frequently instead of leaving large sums idle in the account.
Is ExpertOption Legit or a Scam? My Verdict
After months of testing, I can say confidently that ExpertOption is legit. It may not be perfect, and it may not have the highest regulation in the industry, but it is not a scam. The platform is secure, withdrawals are honored, and trading execution is fair.
That said, success also depends on you. If you jump in without reading the bonus terms, overtrade trying to meet turnover, or deposit more than you can handle, you will likely walk away disappointed. But that is not a scam issue, it is a trader discipline issue.
If you want to replicate my journey, you can open an ExpertOption account here and start with a small test deposit.
Key Lessons I Learned About ExpertOption Safety
Looking back at my months of testing, I realized that the safety of trading with ExpertOption is not only about the broker itself but also about how I approached it. Here are the detailed lessons I wish someone had told me before I started.
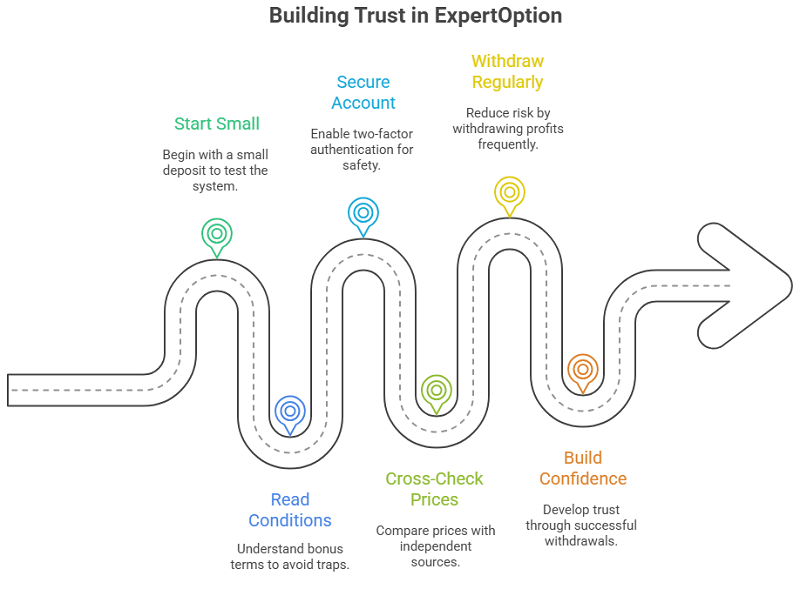
1. Always Start Small and Test Withdrawals First
The smartest decision I made was starting with $50. By doing this, I could test how the deposit and withdrawal system worked without risking too much. Once I saw the withdrawal hit my bank account, my confidence grew. I recommend every trader begins with a small deposit and tries a withdrawal before scaling up. This way, you test the broker’s reliability on your own terms.
2. Read Every Condition, Especially Around Bonuses
Bonuses look tempting, but they can trap you if you do not fully understand the turnover requirements. I learned to always read the fine print before accepting a bonus. If you are still learning or trading with small deposits, skip the bonuses. They only make sense if you are ready for a longer-term commitment.
3. Secure Your Account Before You Trade
It is surprising how many traders skip this step. The first thing I did after creating my account was enable two-factor authentication. I also made sure my email and phone number were verified. This small effort can prevent headaches later in case of hacking or unauthorized access.
4. Always Cross-Check Prices With an Independent Source
One way I built trust in ExpertOption was by comparing their charts with TradingView. Every time I placed a trade, I looked at the same asset on TradingView to see if the prices aligned. They did, which reassured me that I was not being manipulated. You should make this a habit too—it takes less than a minute.
5. Withdraw Regularly Instead of Leaving Money Inside
Even though ExpertOption processed my withdrawals smoothly, I made it a rule to never keep all my trading capital locked in the account. Every time I grew my balance, I withdrew a portion. This not only reduced my risk but also gave me a psychological boost to see the profits in my bank account.
6. Treat Safety as Both Technical and Psychological
The platform may have encryption, licenses, and fast payouts, but safety also depends on how you feel while trading. For me, every successful withdrawal built more trust and made me less anxious about depositing larger amounts. I learned that confidence in a broker grows step by step, not all at once.
Final Thoughts
My journey with ExpertOption taught me a valuable lesson about online trading: the safest broker is the one you personally test. Reviews and opinions can guide you, but until you deposit, trade, and withdraw, you will not know if it is safe for you.
For me, ExpertOption has proven to be reliable. It is licensed under VFSC, provides strong safety features, processes withdrawals on time, and offers a platform that feels modern and transparent.
It is not the strictest-regulated broker in the world, but it has been trustworthy in my experience. If you are careful, disciplined, and realistic, you can trade here with confidence.
If you are ready to experience it yourself, open your ExpertOption account today and start with a small deposit. Then follow the same process I did: test, observe, and decide based on your own results.
Perfect. Expanding the Key Lessons section will give it more weight and make it feel like a practical checklist traders can take away. Adding an FAQ at the end will also target common search queries like “Is ExpertOption safe in my country?” or “Can I withdraw anytime?”, which boosts SEO and keeps readers on the page longer. Here’s the expanded version with both included:
ExpertOption Safety FAQs
Here are the most common questions I had before I started trading, along with what I learned through experience.
Is ExpertOption legit or a scam?
From my personal experience, ExpertOption is legit. It is regulated by VFSC, processes withdrawals on time, and uses proper security features. I tested multiple deposits and withdrawals, and every request was honored.
Is ExpertOption safe for beginners?
Yes, but only if beginners start small. The demo account is a safe place to practice, and the real account works fine as long as you don’t deposit more than you can afford to lose. I would also advise avoiding bonuses at the start to prevent confusion.
Can I withdraw anytime?
Yes. Withdrawals are allowed anytime as long as your account is verified and you are not restricted by bonus turnover requirements. My withdrawals typically took between 24 and 48 hours depending on the method.
Does ExpertOption work in every country?
No, ExpertOption is not available in all regions due to local regulations. It is better to check directly on their website or attempt a registration to see if your country is supported.
What happens if I lose access to my account?
ExpertOption has a recovery system. You can reset your password through your email, and if that fails, their support team will help once you verify your identity with documents. That’s why it’s critical to use real details when signing up.
How safe are my funds inside ExpertOption?
Funds are stored with standard security protocols, and transactions are protected with SSL encryption. I personally felt safer once I saw that my withdrawals were processed correctly. Still, I recommend not keeping your entire trading budget in the account at once.
ExpertOption Bonuses Explained (Hidden Terms Revealed)

When I first signed up with ExpertOption, I was greeted with a message promising, “Deposit today and receive up to 120% bonus.” I paused. The idea of doubling my balance instantly was tempting. Who wouldn’t want extra funds to trade with? But as I learned, bonuses are not as straightforward as they look.

This is my personal story of testing ExpertOption bonuses how I used them in real trades, the hidden terms I discovered, and the lessons I wish someone had told me earlier.
👉 If you want to try ExpertOption responsibly, you can open your account here and explore the bonus system with a clear head.
My First Bonus Experience
I began with a $100 deposit. The system instantly matched it with a 100% bonus, so my balance showed $200. At first, it felt like I had unlocked a hidden advantage. But when I tried to withdraw profits after a few days, I got a notification that my account had not met the wagering requirement.
That was my first reality check. The bonus was real, but it came with conditions I hadn’t fully understood.
Understanding Wagering Requirements
The hidden term behind every ExpertOption bonus is the wagering requirement. This means you need to trade a specific multiple of the bonus before you can withdraw funds.
Here’s an example from my notes:
| Deposit | Bonus | Balance Shown | Wagering Requirement | Turnover Needed |
| $100 | $100 | $200 | 50x bonus | $5,000 trade volume |
It didn’t matter that my account showed $200. Unless I hit $5,000 worth of trade volume, I couldn’t withdraw.
How I Put the Bonus to the Test
Instead of giving up, I decided to treat the bonus as a challenge. I kept a detailed record of my trades to see if I could realistically meet the turnover without burning through my account.
Trade Breakdown: My $100 Bonus in Action
Trade 1: EUR/USD Call
- Stake: $20
- Outcome: Win (+$16 profit)
- Balance: $216
This win gave me early confidence. But I reminded myself that the turnover requirement still stood far away.
Trade 2: GBP/JPY Put
- Stake: $30
- Outcome: Loss (-$30)
- Balance: $186
Suddenly, the bonus cushion looked less reliable. I was down below my starting balance despite “having more money.”
Trade 3: Gold (XAU/USD) Call
- Stake: $25
- Outcome: Win (+$20 profit)
- Balance: $206
This put me back above $200, but I realized something important: the bonus made my account look bigger than it felt. Each loss hit harder than expected.
My Turnover Progress
| Date | Trade Count | Volume Traded | Balance | Progress Toward $5,000 |
| Week 1 | 12 | $280 | $206 | 5.6% |
| Week 2 | 20 | $510 | $228 | 15.8% |
| Week 3 | 35 | $900 | $240 | 33.6% |
| Week 4 | 50 | $1,400 | $218 | 52.6% |
By the end of the first month, I had traded over $1,400 in volume but was still only halfway to the required turnover. The bonus was pushing me to stay active, but it also meant my funds were tied up longer than I liked.
👉 If you want to test ExpertOption with bonuses, sign up here but remember: every trade counts toward the turnover, not just the profitable ones.
What the Bonus Taught Me
The deeper I went, the clearer the lessons became:
- The bonus is not free money. It is leverage tied to conditions.
- Trade volume matters more than profit in terms of unlocking withdrawals.
- Patience and discipline are the only way to make bonuses work.
- A reckless approach to hit turnover faster almost always ends badly.
Got it. Let me expand that section into a fuller, more storytelling-driven piece with examples, explanations, and smoother flow while keeping it SEO-friendly. Here’s the expanded version:
Are ExpertOption Bonuses Worth It?
After spending several months testing different ExpertOption bonuses, I reached a balanced conclusion. They are not inherently good or bad—they are tools. Like any tool, their value depends entirely on how you use them.
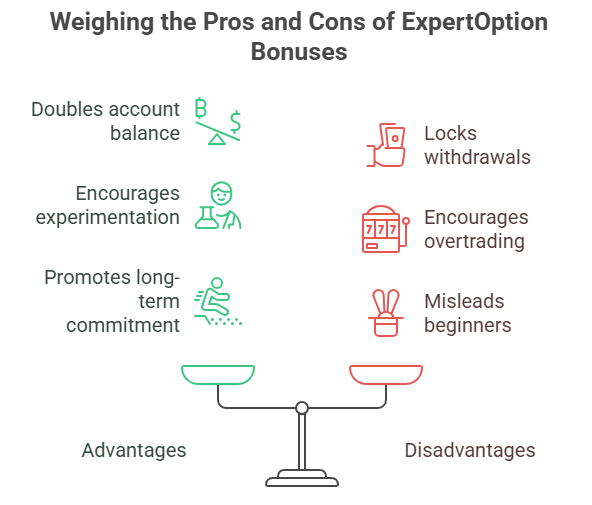
Advantages of ExpertOption Bonuses
1. Doubles account balance instantly
When I made my first deposit of $100, the 100% bonus immediately showed my balance as $200. It gave me a sense of confidence and more room to maneuver. That cushion allowed me to take trades I might have avoided with a smaller balance. For example, instead of sticking to $5 positions, I felt comfortable testing $20 trades, which helped me learn faster.
2. Gives extra breathing room for learning and experimenting
In my early weeks, I lost a few trades in a row. Without the bonus, my account would have dropped dangerously close to zero. The bonus kept me alive long enough to test strategies, analyze patterns, and understand market reactions. It wasn’t “free money,” but it gave me more learning space.
3. Encourages long-term commitment to trading
The turnover requirement forces you to stay engaged with the platform. At first, this felt like a burden. But over time, I realized it helped me avoid the trap of quick-deposit, quick-withdrawal gambling. It made me approach trading as a consistent practice instead of a one-time bet.
Disadvantages of ExpertOption Bonuses
1. Locks withdrawals until turnover is met
This is the biggest drawback. The bonus ties up your funds until you hit the required trade volume. For example, with a $100 bonus and a 50x requirement, I needed to trade $5,000 in volume before I could withdraw. Even when I had profit in my account, I couldn’t touch it until I crossed that threshold. That felt frustrating when I just wanted to secure some gains.
2. Can encourage overtrading
Knowing I had to reach a specific turnover target tempted me to trade more than I normally would. Some days I placed back-to-back trades, not because I saw a good setup, but because I wanted to get closer to the requirement. This often backfired. Overtrading led to unnecessary losses and emotional decision-making.
3. Misleads beginners into thinking they have more capital than they actually do
When you see $200 in your balance after depositing $100, it feels like you’ve doubled your capital. But in reality, part of that balance is locked by conditions. It creates a psychological illusion of having more resources than you can actually use freely. I fell for this illusion myself, taking trades that were too large for my real deposit.
My Honest View
In the end, I see ExpertOption bonuses as tools for disciplined traders. They give you leverage, but leverage can either build or destroy. If you are patient, methodical, and treat the bonus as a structured opportunity, it can work in your favor. But if you rush, chase turnover, or get blinded by the bigger balance, the bonus will hurt more than it helps.
Lessons I Wish I Knew Earlier
Looking back at my journey with ExpertOption bonuses, there are several things I wish someone had told me on day one:
1. Always check the wagering requirement before accepting
Don’t get excited by the percentage of the bonus alone. A 100% bonus sounds better than a 50% bonus, but if the turnover requirement is too high, you might regret it. Understanding the conditions is more important than the size of the offer.
2. Track turnover progress daily
One mistake I made was trading blindly without tracking how much volume I had completed. When I finally checked, I was far from the target. I later started keeping a simple table in my notebook, marking each day’s trade volume. This gave me a realistic sense of progress and kept me motivated without overtrading.
3. Avoid bonuses on small deposits
If I deposited $50 or $100 just to test a strategy, I avoided bonuses altogether. The turnover requirement on small deposits often felt disproportionate. It locked me in when I wanted flexibility. I learned to reserve bonuses for larger deposits where I was willing to commit longer.
4. Accept them only when committing to longer-term trading
The bonus only makes sense if you plan to stay active for weeks or months. If you just want to test the platform or make a quick withdrawal, skip it. I realized that bonuses reward consistency, not speed.
5. Remember that the bigger balance is partly psychological
This is perhaps the most important lesson. The extra balance is not fully mine until the requirement is met. It’s easy to trick yourself into thinking you have more money than you do. Once I understood that, I adjusted my trade sizes back to levels that matched my real deposit, not the inflated bonus balance.
Connecting the Dots with Other Features
What surprised me was how my experience with bonuses tied into other parts of my trading journey. When I studied candlestick patterns (I documented that here), I realized I could slow down and pace my trades better.
Later, when I experimented with copy trading (full notes here), I noticed some traders managed their bonuses effectively by sticking to consistent trade sizes. Observing them reinforced my own discipline.
Final Thoughts: My Honest Verdict
So, are ExpertOption bonuses worth it?
For me, the answer is yes—with caution. They are not gifts, they are agreements. When I respected the conditions, I benefited. When I ignored them, I felt trapped.
My advice to any beginner is simple: do not let the excitement of a doubled balance cloud your judgment. Accept a bonus only when you have a plan to meet the turnover requirement calmly and strategically.
👉 If you want to explore ExpertOption bonuses yourself, create your account here and trade smart with full awareness of the hidden terms.