How I Mastered Correlation Trading in Binary Options

I still remember the night I almost threw my laptop across the room. I was staring at a 60-second EUR/USD chart, trying to predict whether the next candle would finish green or red. To me, it felt like flipping a coin in a dark room. I did everything the gurus told me to do. I loaded my screen with RSI, MACD, and Bollinger Bands until the actual price bars were barely visible. Still, my account balance kept bleeding.
That was the day I realized a harsh truth. I was looking at the market in absolute isolation. I treated the EUR/USD like it was the only financial instrument on the planet.
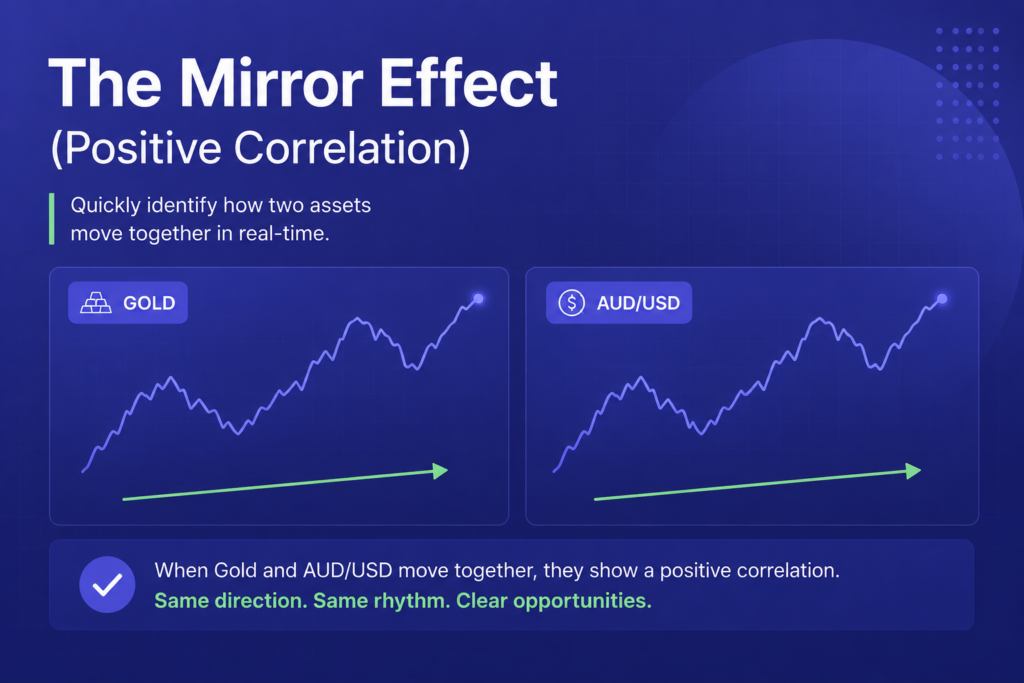
Everything changed when I accidentally opened two chart windows side by side: Gold and the AUD/USD currency pair. As Gold began to climb, a few minutes later, the AUD/USD followed it upward like an obedient shadow. They weren’t identical, but they were deeply connected.
That was my introduction to correlation trading. It is the strategy that took me from a frustrated novice to a trader who actually understands why the markets move. If you are tired of losing trades because a single candle suddenly spikes against you, let me share how looking at the bigger picture can completely transform your binary options journey.
The Epiphany of the Connected Market
When you are starting out, binary options look deceptively simple. You choose an asset, select an expiry time, and click “Higher” or “Lower.” Because of this simplicity, it is incredibly easy to fall into bad habits. In fact, understanding how assets interact is one of the main differences between those who find consistency and the overwhelming number of people who fail. If you want to know more about those early traps, you can read about why 90 percent of traders lose money to see exactly what to avoid.
Correlation trading is the practice of analyzing two separate assets that share a historical relationship to predict the price movement of one of them. In the financial world, assets do not move in a vacuum. Economies are tied together by supply, demand, and global politics.
When you learn to spot these relationships, you gain a massive advantage. Instead of staring at one chart and guessing where it will go, you watch a leading asset to see what your target asset is likely to do next. It is like having a weather forecast for your trades.
Before you can trade this strategy effectively, you need a platform that lets you view multiple charts simultaneously or switch between them instantly without lag. When I was testing this strategy, I spent a lot of time finding the right home for my funds. You can check out my breakdown of the top 3 trading platforms that actually pay to see which setups handle multiple asset analysis the best.
Positive and Negative Correlations Explained
To use this strategy, you need to understand the two ways assets interact: positive correlation and negative correlation.
Positive correlation means two assets move in the same direction. When Asset A goes up, Asset B goes up. A classic example is Gold and the Australian Dollar (AUD). Australia is one of the largest gold producers in the world. When the price of Gold rises, the Australian economy strengthens, which usually pushes the value of the AUD higher.
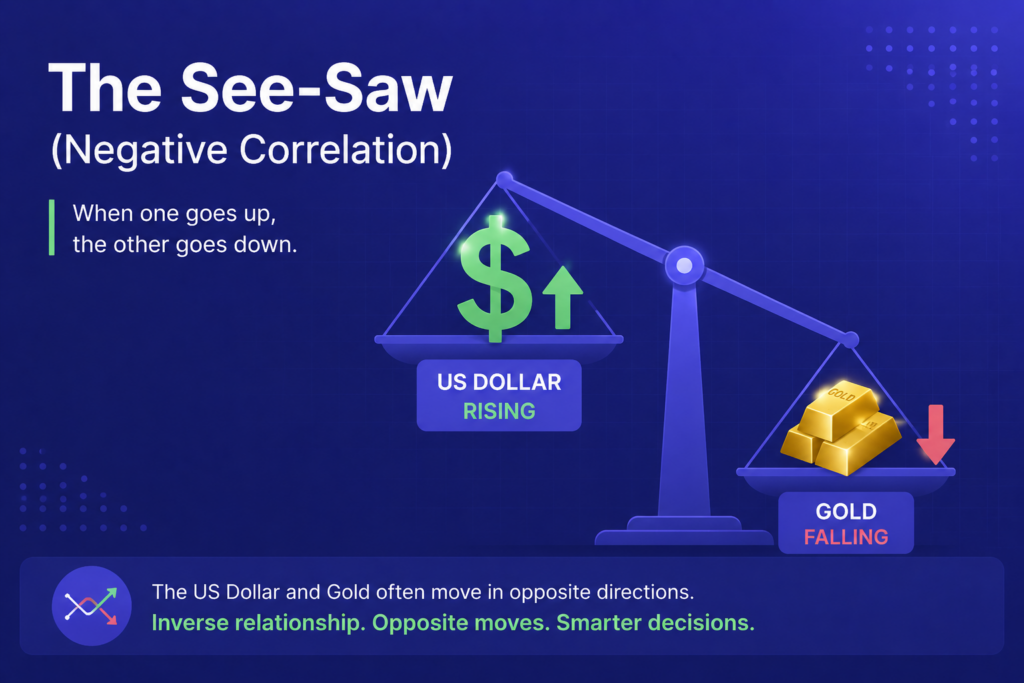
Negative correlation means two assets move in opposite directions. When Asset A goes up, Asset B goes down. The most famous example is the US Dollar (USD) and Gold. Because Gold is priced in US dollars globally, a stronger dollar makes Gold more expensive for overseas buyers, driving its price down. Therefore, if the USD index spikes upward, Gold typically drops.
When I first started executing these trades, I needed a broker with an interface clean enough to track these movements without giving me a headache. If you are struggling with a cluttered screen, take a look at my real comparison of which broker has the cleanest interface to make your charting experience much smoother.
My Go-To Correlation Pairs for Beginners
If you want to practice this strategy today on a demo account, here are the pairs I highly recommend monitoring:
- Gold (XAU) and AUD/USD (Positive): Watch Gold for the leading move. If Gold breaks through a major resistance level and climbs, look for a “Higher” binary option opportunity on AUD/USD on the next candle.
- Brent Crude Oil and USD/CAD (Negative): Canada is a massive exporter of oil. When oil prices rise, the Canadian Dollar strengthens. Because CAD is the second currency in the USD/CAD pair, a stronger CAD pushes the overall USD/CAD chart downward. So, when Oil goes up, look for a “Lower” option on USD/CAD.
- EUR/USD and USD/CHF (Negative): The Euro and the Swiss Franc generally move together against the US Dollar. Because the USD is the base currency in USD/CHF and the quote currency in EUR/USD, these two pairs move like opposite mirrors. If EUR/USD rallies, USD/CHF almost always falls.
To trade these pairs smoothly, you need an environment with fast execution. I personally love comparing platforms to see which ones offer the best interface for tracking these pairs. For a direct comparison of two massive platforms, you can check out my guide on Deriv vs IQ Option for beginners in 2026 to see how they stack up for new traders.
How I Execute a Correlation Trade Step by Step
Let me walk you through exactly how I traded a negative correlation between the US Dollar and Gold just last week.
First, I opened two charts side by side. On the left was the US Dollar Index (DXY) or a major USD pair like USD/JPY. On the right was Gold (XAU/USD). I set both charts to the 5-minute timeframe.
Second, I waited for a market catalyst. I watched the USD/JPY break out of a morning consolidation zone, surging violently upward through a known resistance level.
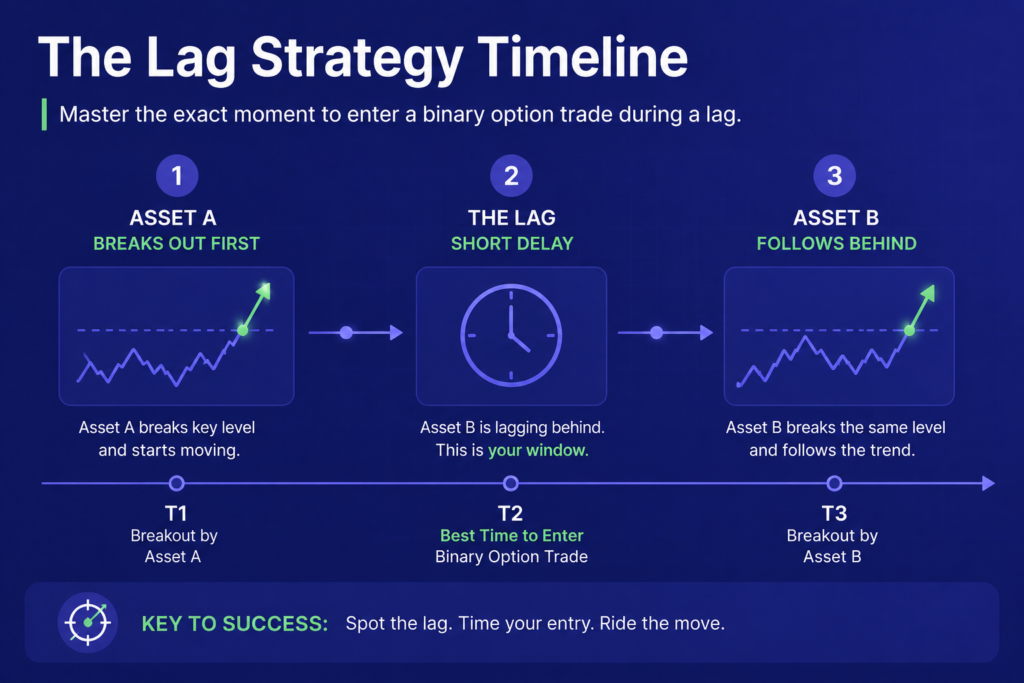
Third, I looked over at my Gold chart. Because of the negative correlation, I expected Gold to drop. However, Gold hadn’t moved yet; it was stalling at the top of a recent bullish candle. This is what traders call a “lag.” The correlation gave me an early warning of what was coming.
Fourth, I quickly opened my binary options platform, selected Gold, set a 15-minute expiry time to give the market room to breathe, and placed a “Lower” trade. Within three minutes, the surging US Dollar dragged Gold down, and my trade cleared safely in the profit.
If you want to try this strategy on platforms that offer excellent charting tools, you can sign up and practice using the IQ Option registration portal or explore the multi-chart features available through the Binomo platform setup. Both platforms give you the visual flexibility needed to track these assets side by side.
Managing the Risks of the Broken Correlation
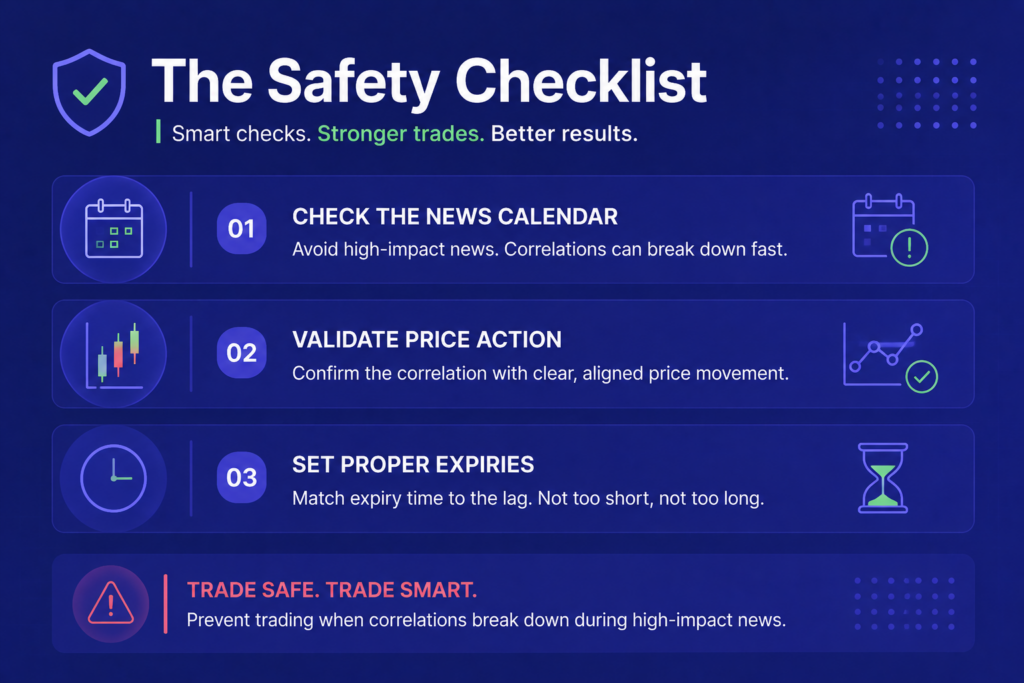
Here is the warning the textbook writers won’t tell you: correlations do not work 100 percent of the time. They are tendencies, not absolute laws.
There are times when a correlation breaks down. For example, during a major global economic crisis, investors might rush into both the US Dollar and Gold at the exact same time looking for safety. Suddenly, a pair that usually moves in opposite directions is moving upward together. If you blindly place trades assuming the correlation holds, you will take losses.
To protect my capital, I never enter a trade based solely on correlation. I use correlation as an alert system. Once the correlation shows me a potential setup, I look at the target asset’s actual price action. If Gold should drop because the USD is rising, I wait until I see at least one bearish rejection candle on the Gold chart before clicking “Lower.”
Choosing the right broker also plays a huge role in risk management. You need a platform that offers transparent pricing and reliable expiries so your correlation analysis isn’t ruined by bad execution. For a deep dive into platform security, read my analysis on the safest trading platforms and their risk breakdowns to keep your capital secure.
Taking Your Technical Edge to the Next Level
Correlation trading completely changed how I look at financial markets. It took me away from the chaotic guessing games of short-term charts and forced me to think like a professional macro trader. Suddenly, the market made sense.
If you are just getting started and want to build your routine without risking massive amounts of capital, you can read my guide on how much money you really need to start trading for a realistic view of building an account. For those who want to jump right into practicing with other reliable brokers, you can also look into the Deriv tracking setup, try out the Pocket Option fast track, check out the Quotex registration gateway, explore ExpertOption accounts, or look at the tools provided on CapitalCore trading.
However, monitoring global macro relationships, tracking economic calendars, and calculating mathematical correlation coefficients by hand can become overwhelming if you are doing it completely alone. It takes hours of daily screening to find the highest-probability setups.
That is exactly why I stopped doing all the heavy lifting myself. If you want to skip the endless hours of chart watching and get straight to actionable data, you can view live market setups at the Becoin Forecast Hub.
If you are ready to truly gain a professional edge, stop guessing, and trade with deep analytical backing, unlock daily high-probability asset insights by joining the Becoin Premium Membership program today. Let the experts scan the correlations while you focus on executing flawless trades.